Dogecoin price consolidates while DOGE targets $1
- Dogecoin price continues to stabilize along the 50-day simple moving average (SMA).
- A decisive daily close above the descending channel’s upper trend line renews bullish outlook.
- IntoTheBlock IOMAP data shows a stand-off between resistance and support around the 50-day SMA.

Dogecoin price has begun consolidating along the 50-day SMA and above the midline of the descending channel since May 20. Over the last few days, the relative strength shown by DOGE is a noteworthy divergence considering that it was created as a joke and has no utility. In times of market dislocation, it is imperative to seek out relative strength, and the meme-token is becoming one of those leaders.
Dogecoin price elevates above the crypto market panic
Dogecoin price declined about 75% from the May 8 high at $0.760 to the May 19 low at $0.195, putting it on the higher side of the range for declines from peak to low. However, the digital token did achieve a 70% rally off the May 19 low, closing DOGE back above the 50-day SMA where it has traded over the last six days, excluding the brief drop on May 23.
The significant decline and ensuing consolidation have released the overbought condition on the weekly Relative Strength Index (RSI) and nudged the daily RSI to the lowest reading since October 2020. Moreover, the daily volume on down days has not surpassed the 50-day SMA since May 10. In fact, excluding the May 19 crash, daily volume on down days has been around 25% of the 50-day average, reflecting no rush for the exits by investors.
Today, Dogecoin price tagged the channel’s upper trend line before reversing with the overall cryptocurrency market. It is a normal reaction to a resistance level that has held since early May, particularly in a market experiencing wide gyrations.
A daily close above the channel’s upper trend line will be the preliminary indication that the consolidation is complete and Dogecoin price is ready to retrace the decline. If the breakout gains traction, DOGE will be met with resistance at the 50% retracement level of the May correction at $0.477, which coincides very closely with the April 16 high at $0.470 and the May 19 high at $0.492. A successful close above $0.492 would yield a high probability entry spot.
It will require a considerable thrust to break the resistance mentioned earlier before Dogecoin price engages the 61.8% Fibonacci retracement at $0.544. More resistance will follow at the May 14 high at $0.604 before a clear path emerges to the topside trend line beginning January 29, currently at $1.034.
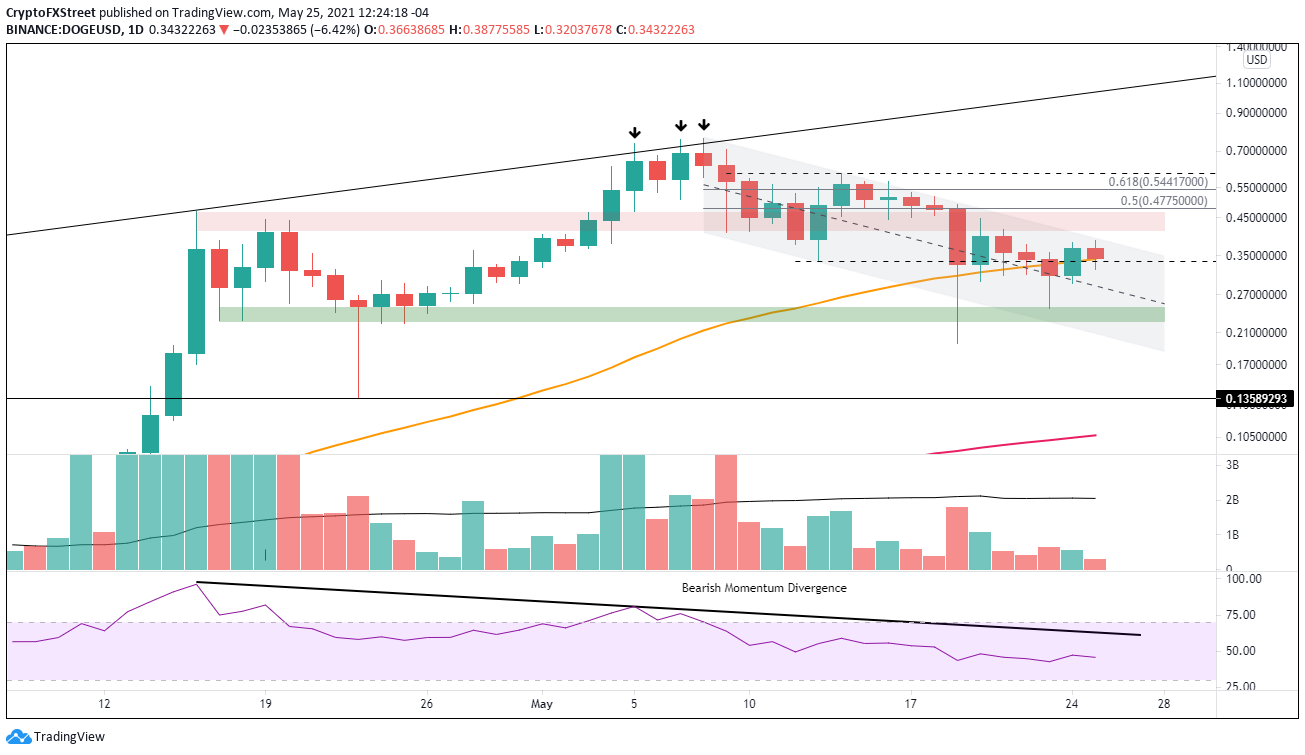
DOGE/USD daily chart
Transparent support for DOGE begins at the channel’s midline at $0.285, followed by a price range of $0.250-$0.228, created by the shadows of several candlesticks in April and May 23 low at $0.246.
An acceleration of selling pressure will lead Dogecoin price to the channel’s lower trend line, currently at $0.207 and likely a test of the May 19 low at $0.195.
For interest’s sake, the wide swings in May have set Dogecoin price up for a monthly doji candlestick, reflecting a balance between supply and demand.
On-chain data points to an important stand-off
The new IntoTheBlock In/Out of the Money Around Price (IOMAP) data shows a sizeable number of out-of-the-money (resistance) addresses around the 50-day SMA at $0.342. One cluster is of 29.83k addresses owning 3.23 billion DOGE at an average price of $0.347. The second cluster comprises 75.4k addresses holding 3.92 billion DOGE at an average price of $0.361. A push above these two clusters frees Dogecoin price to rally unimpeded to $0.400.
On the in-the-money (support) side, there are two important clusters of support, also around the 50-day SMA. One cluster is formed by 29.51k addresses holding 4.55 billion in DOGE at an average price of $0.333, and the second comprises 76.19k addresses holding 3.44 billion DOGE at an average price of $0.320.
The IOMAP explains the recent price action and suggests the standoff will continue in the short term.
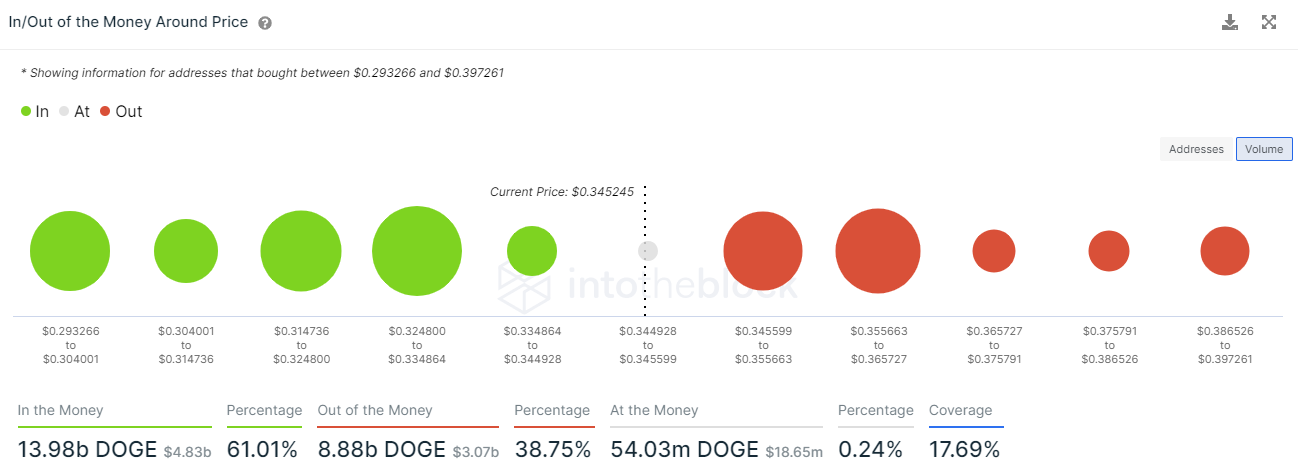
DOGE IOMAP data
Dogecoin price is locked in a tight range, surrounded by essential support and resistance levels. Still, technicals are tilted towards a bullish resolution of the consolidation and a renewed effort to retrace the meaningful decline in May.
Author

Sheldon McIntyre, CMT
Independent Analyst
Sheldon has 24 years of investment experience holding various positions in companies based in the United States and Chile. His core competencies include BRIC and G-10 equity markets, swing and position trading and technical analysis.


