Dogecoin price outlook unclear as DOGE confronts a crypto market painted in red
- Dogecoin price holding the 50-day simple moving average (SMA) as cryptocurrency market presses to the downside.
- A decisive close above the descending channel’s upper trend line renews bullish outlook.
- DOGE shows a doji candlestick on the monthly chart, marking indecision among investors.

Dogecoin price recovered the 50-day SMA on May 19, unlike most other cryptocurrencies. The descending channel’s midline has reinforced the support. Heading into the last week of May, DOGE may continue to consolidate the rebound at today’s levels, but in a market overrun with selling, the odds are not in favor of a bullish outcome.
Dogecoin price recovery needs more than social media
From the May 8 high to the May 19 low, Dogecoin price collapsed over 70%, generating one of the largest declines for any cryptocurrency over that time frame. On May 19, DOGE fell 60%, one of the largest declines during the crash, before bouncing 70% by the close.
The Dogecoin price crash overwhelmed support at the declining channel’s lower trend line at $0.265, the 78.6% Fibonacci retracement of the rally from the April 23 low to the May 18 high at $0.269 and a price range defined by multiple daily lows in April between $0.225 and $0.250.
Today, Dogecoin price is trading in line with Bitcoin, down around 11% at time of writing, demonstrating an elevated level of relative strength compared to most of the cryptocurrencies under coverage. However, as was witnessed on May 19, DOGE is vulnerable to wide price swings in times of market dislocation. That will be no different in the future, especially considering the increasing number of traders operating in the meme-based token.
Due to a generally bearish bias on the crypto market, the short-term outlook for Dogecoin price is also negative. Immediate support continues to develop at the 50-day SMA at $0.319 and the channel’s midline around $0.320. A new rush of selling will quickly test the 78.6% retracement at $0.269 before finding a struggle at the confluence of the channel’s lower trend line with the previously mentioned price range at $0.243.
Any further Dogecoin price weakness will target the May 19 low at $0.195 and potentially the April 23 low at $0.135.
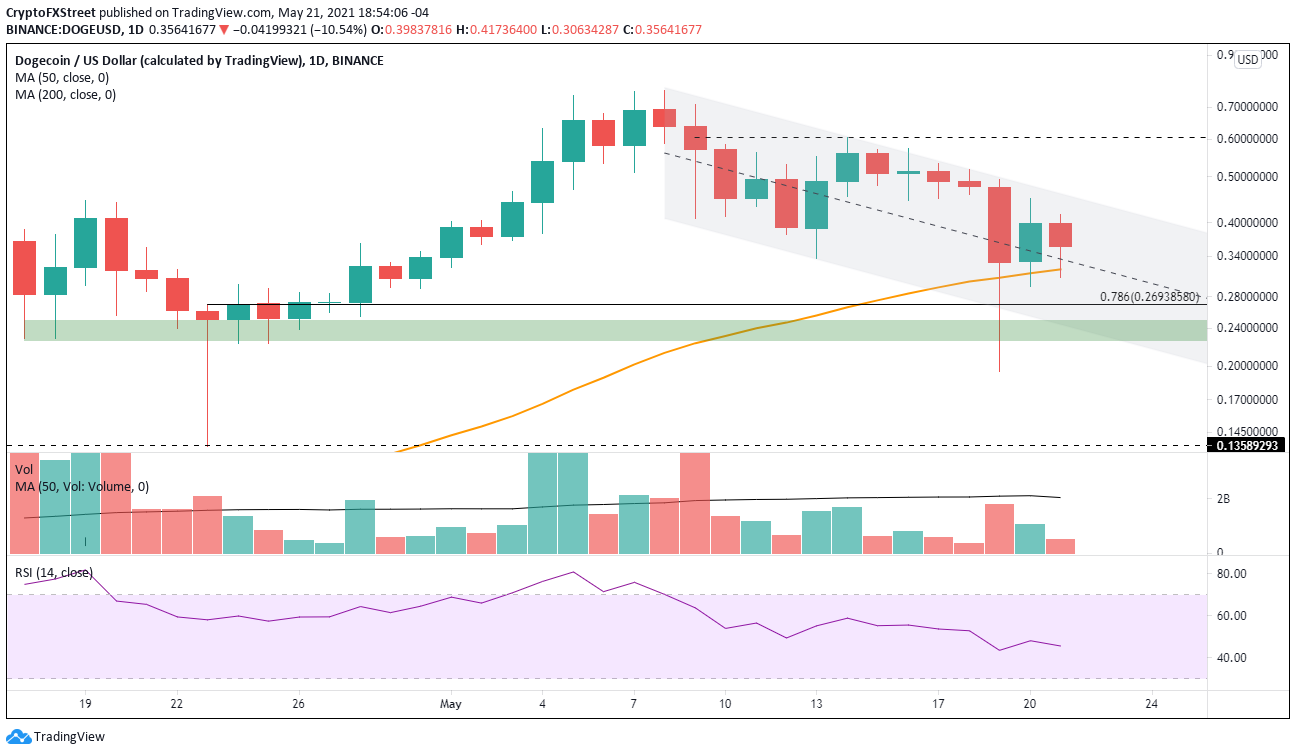
DOGE/USD daily chart
A bullish resolution of the DOGE consolidation needs a daily close above the channel’s upper trend line at $0.461. The subsequent resistance levels are the May 14 high at $0.604 and the topside trend line at $0.943.
DOGE is a unique investment situation due to the continual support from recognized business people channeled through social media platforms. It has been demonstrated that a simple tweet can catapult Dogecoin price well beyond 20% in a matter of minutes. However, in this new environment created by the May 19 crash combined with the indecision expressed by the doji candlestick on the monthly chart, DOGE investors will need more than a tweet to overcome the current technical challenges.
Author

Sheldon McIntyre, CMT
Independent Analyst
Sheldon has 24 years of investment experience holding various positions in companies based in the United States and Chile. His core competencies include BRIC and G-10 equity markets, swing and position trading and technical analysis.




