Decentraland bulls go against the bearish trend, targeting $2.60
- Decentraland price looks to be set to close the week in profit.
- MANA price action went against the tide, with global markets nervous and still jitters after the Fed tightening announcement.
- A weekly close above the S1 and Fibonacci low should trigger a return to the upside.

Decentraland (MANA) price has been on the front foot in a challenging market environment. MANA bulls look ready to eke out 28% of gains for this week after the price lifted from the 200-day Simple Moving Average (SMA) and is now set to pop and stay above the monthly S1 support level. Expect more investors to join the rally once the MANA price can consolidate above the S1 and set $2.57 later today as the price target.
MANA price set for 15% price hike
Decentraland was forming a falling knife last week but got picked up after the bounce off the $1.67 handle and went against the tide this week as the 200-day SMA around $2.0 offered a window of opportunity for more bulls to extend the recovery. In a slow grind, price action again space and lifted MANA 28% until Decentraland price is hovering. As bulls are now trying to consolidate above the monthly S1 at $2.24, and with that as well reentered the Fibonacci retracement to all-time highs.
MANA price is yet still far away from any all-time highs. Global markets still look very much on edge, but that does not mean that Decentraland price action will disappoint to the upside. Expect more investors to come in during the US session if MANA price can stay above $2.24. That trigger and inflow will see price action propel further upwards to tick $2.57, the low from December 04 and set as an easy profit target to be reached.
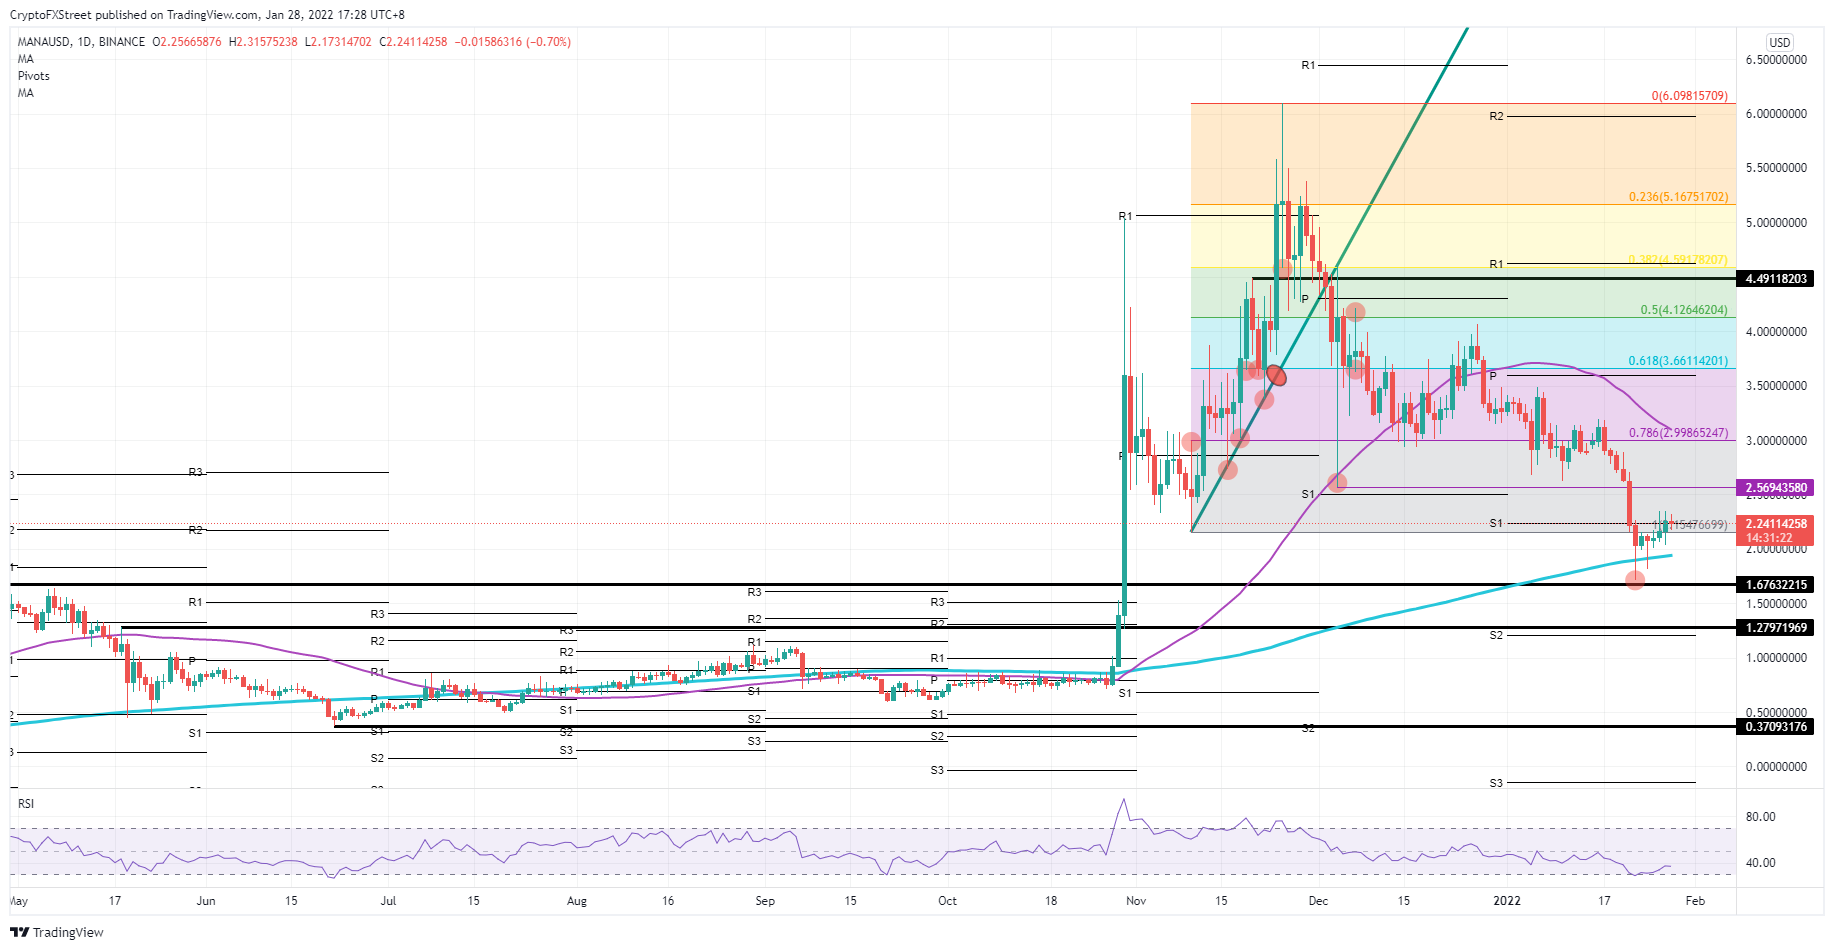
MANA/USD daily chart
The monthly S1 can be proven slippery when wet, and price action could easily slide back below, triggering bulls to take their money and run. MANA price would be plie back against the 200-day SMA, break it and fulfill the swing trade towards $1.67. Would the swing lower trigger an even more aggressive selloff from bulls and investors, expect a short overshoot towards $1.28, just above the monthly S2.
Author

Filip Lagaart
FXStreet
Filip Lagaart is a former sales/trader with over 15 years of financial markets expertise under its belt.



