|

Decentraland price targets $2.50 to terminate downtrend

  • Decentraland price at an inflection point.
  • MANA completed a 50% logarithmic retracement, fulfilling conditions for a new floor to target new highs.
  • $2.50 is the critical resistance zone to break above to initiate a new bull run.

Decentraland price has rallied strongly since it hit three-month lows at $1.70. Since then, MANA has spiked nearly 39% off the lows to hit $2.25.

Decentraland faced strong Ichimoku and Fibonacci resistance at $2.50

Decentraland bulls have been thirsty to repeat the rally it experienced in October 2021. There is no reason why MANA can’t repeat that success, especially given the growth in interest and investment into the metaverse and gaming-token space. However, significant hurdles exist and will be tested before Decentraland can return to its highs.

The first hurdle that Decentraland price must defeat is a confluence zone of resistance between the Tenkan-Sen at $2.50 and the shared $2.58 price level with the 38.2% Fibonacci retracement and Kijun-Sen. The likelihood of MANA pushing through the $2.58 zone decreases significantly if the Composite Index oscillator creates a high above the January 16 high (in the oscillator) – hidden bearish divergence. But if MANA can create a close above the January 16 close, then the hidden bearish divergence will be avoided.
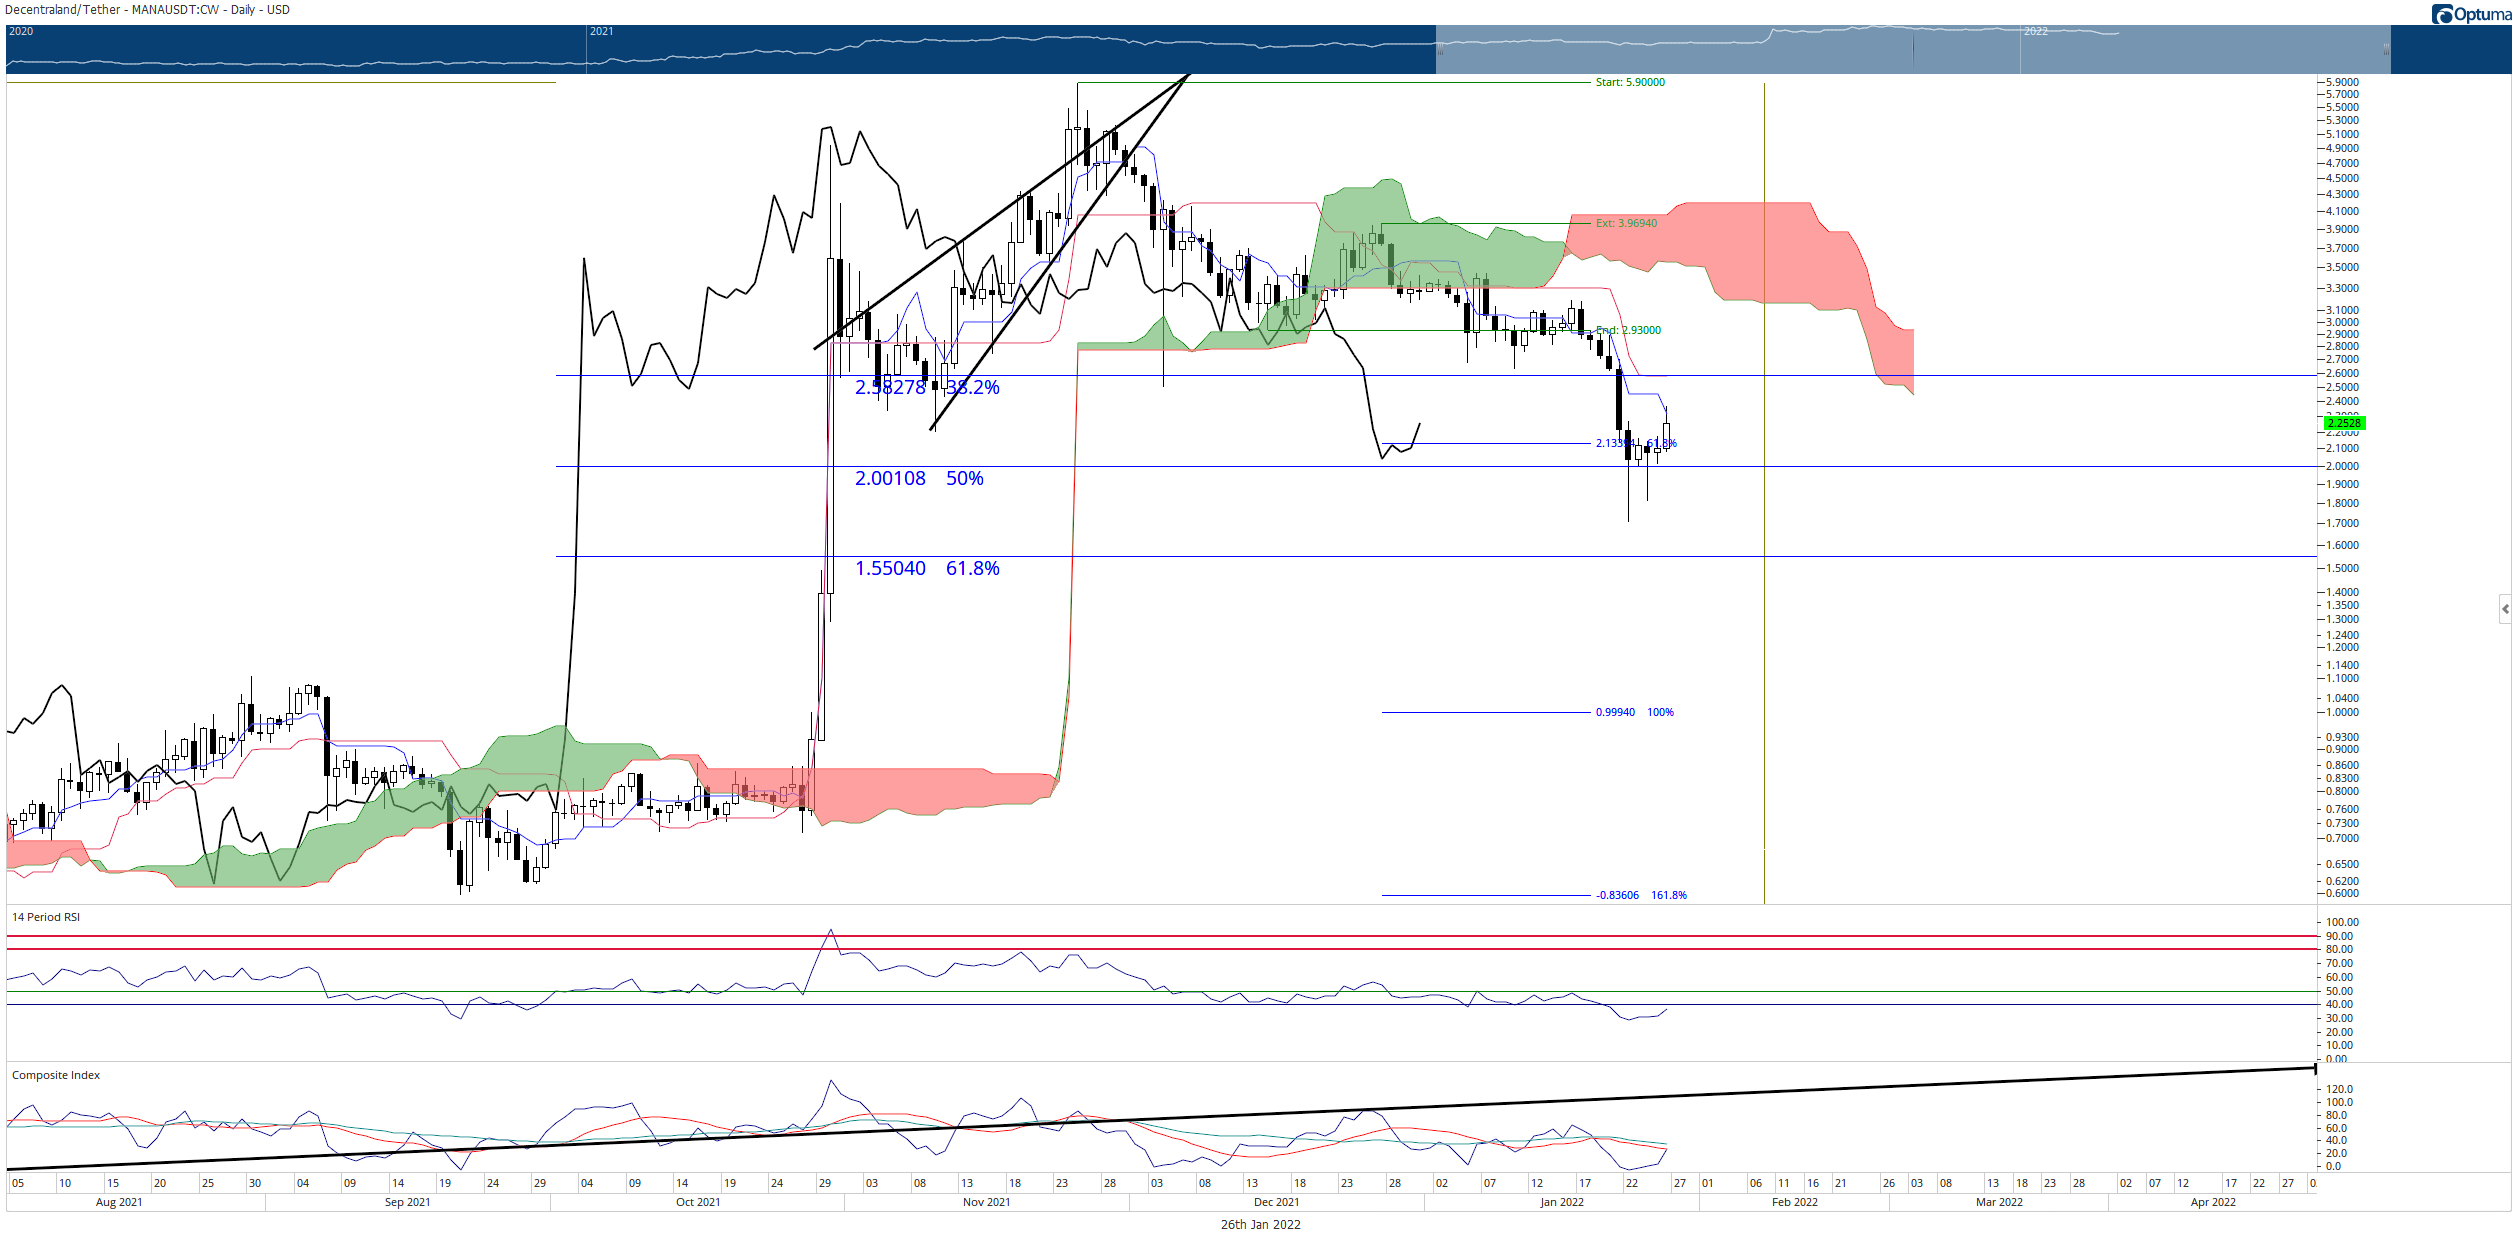
MANA/USDT Daily Ichimoku Kinko Hyo Chart

Downside risks remain strong but should be limited to the 50% Fibonacci retracement at $2.00. Any further bullish outlook is invalidated if a daily or weekly close is below $2.00. MANA would likely push towards the 61.8% Fibonacci retracement in that scenario at $1.55.

Author

Jonathan Morgan

Jonathan Morgan

Independent Analyst

Jonathan has been working as an Independent future, forex, and cryptocurrency trader and analyst for 8 years. He also has been writing for the past 5 years.


More from Jonathan Morgan
Share:

Editor's Picks

Bitcoin Weekly Forecast: BTC retreats as macro headwinds grow
Bitcoin (BTC) remains under pressure, down over 4% this week and trading around $76,900 at the time of writing on Friday. Institutional demand shows signs of weakness as spot BTC Exchange Traded Funds (ETFs) are on track to end their three-week inflow streak, recording nearly $500 million in net outflows through Thursday.
XRP falls toward key support as macro uncertainty, weak momentum cap recovery
Ripple (XRP) falls below $1.33 on Friday, marking the third consecutive day of declines. The token continues to track the broader cryptocurrency market downturn, with investors closely monitoring heightened macroeconomic uncertainty ahead of the United States (US) Consumer Price Index (CPI) release and next week’s Federal Reserve (Fed) monetary policy decision.
Crypto Today: Bitcoin, Ethereum, XRP stabilize at lower levels amid ETF outflows and macroeconomic risks
The broader cryptocurrency market is rising on Friday, with Bitcoin (BTC) trading above $77,000 after testing lower support near $76,500. Ethereum (ETH) shows signs of stability, hovering above the support provided at $2,400 despite capped upside at $2,500. Meanwhile, Ripple (XRP) holds above $1.33 after three straight days of declines, reflecting growing headwinds due to macroeconomic uncertainty.
Bitcoin pulls back as another golden cross fails to deliver
Earlier this week, Bitcoin formed a golden cross, a technical signal that occurs when the price’s 50-day moving average rises above the 200-day moving average and is conventionally viewed as a precursor to a bullish rally. Historically, however, that’s often not been the case.
Bitcoin: BTC retreats as macro headwinds grow
Bitcoin (BTC) remains under pressure, down over 4% this week and trading around $76,900 at the time of writing on Friday. Institutional demand shows signs of weakness as spot BTC Exchange Traded Funds (ETFs) are on track to end their three-week inflow streak, recording nearly $500 million in net outflows through Thursday.


