Chainlink Price Analysis: LINK targets new record highs at $30 as investors remain optimistic
- Chainlink rebounds from short-term support at $20, targeting new all-time highs at $30.
- LINK has no formidable resistance ahead, according to the IOMAP model.
- A correction will come into play if LINK fails to break an ascending channel’s middle boundary.
-637336005550289133.jpg)
Chainlink has been among the best performers in January, leading recovery for both altcoins and decentralized finance (DeFi) related tokens. Besides stepping above $20 (former all-time high), LINK went ballistic to hit a new record high at $25. For now, the least resistance path is upwards after Chainlink bounced off support at $20.
Chainlink nurtures uptrend while uptrend eyes $30
Bulls appear to have regained control following the confirmation of support at $20. A more comprehensive glance at the 4-hour chart brings to light the ascending parallel channel. The lower boundary has been instrumental to the ongoing uptrend from the beginning of the year.
Meanwhile, LINK is teetering at $23.5 while battling the resistance at the channel’s middle boundary. The action above this short-term hurdle will add credence to the bullish outlook. Realize that the smart contract live price feed oracle token must overcome the hurdle at $25 to continue with the leg up to $30.
The Relative Strength Index has also abandoned the downtrend in favor of recovery above the midline. The indicator’s movement toward the overbought will encourage more buyers to join the market if not to increase their positions.
-637474127374670577.png)
LINK/USD 4-hour chart
According to Michaël van de Poppe, a prominent analyst, Chainlink “is an example of: so far, so good.” The LINK/BTC chart reveals that the next resistance target is 74,000 satoshi. At the moment, the primary battle is rise above the hurdle at 83,000 Sats.
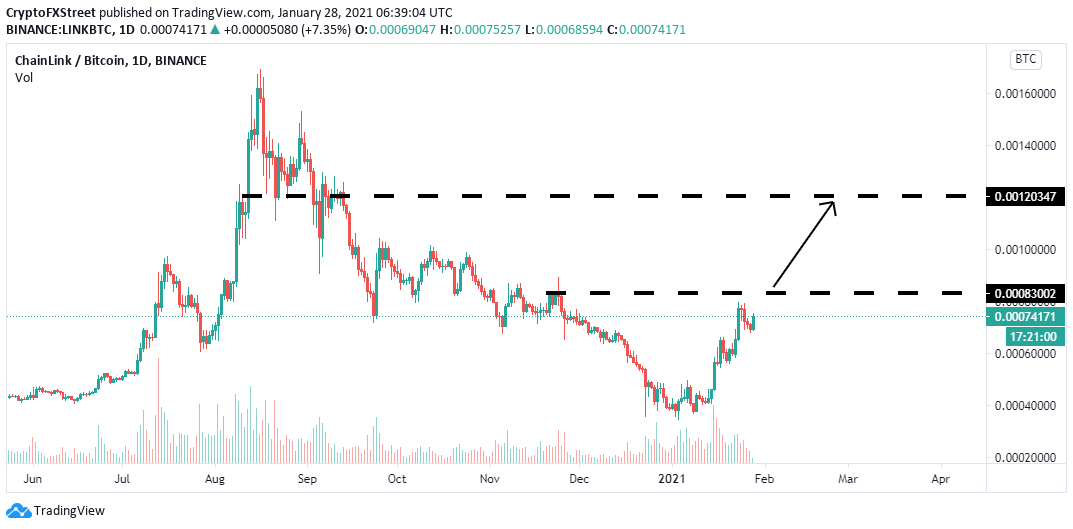
LINK/BTC 4-hour chart
The IOMAP model by IntoTheBlock reveals no robust resistance standing in the way of a Chainlink’s upswing to $30,000. However, buyers must channel their attention to the range between $24 and $24.11. Here, approximately 3,400 addresses have previously bought 1.6 million LINK. Trading above this zone may catapult Chainlink to new record highs.
On the other hand, Chainlink is sitting on areas with immense support, suggesting that breakdown is a farfetched idea. The most intense buyer congestion zone runs from $22.4 to $23. Here, nearly 6,900 addresses are profiting from the roughly 8.6 million LINK previously bought.
-637474127918156797.png)
Chainlink IOMAP chart
Looking at the other side of the picture
It is worth mentioning that LINK will abandon the anticipated rally above $25 and toward $30 if the resistance at the ascending channel’s middle boundary fails to hold. In case of a correction, support at $20 (channel’s lower edge) on the 4-hour chart must hold.
Trading beneath these key levels might call for massive sell orders, forcing Chainlink to revisit lower anchors at $17.5 and $15, respectively.
Author

John Isige
FXStreet
John Isige is a seasoned cryptocurrency journalist and markets analyst committed to delivering high-quality, actionable insights tailored to traders, investors, and crypto enthusiasts. He enjoys deep dives into emerging Web3 tren


