Chainlink Technical Analysis: LINK en-route $28, with bull flag in play
- Chainlink price corrects from all-time highs of $25.51.
- Bull pennant, bullish crossover on the 1H chart calls for more gains.
- RSI turns south but holds well above the midline, in the bullish zone.
-637336005550289133.jpg)
Chainlink (LINK/USD) appears to have stalled its corrective pullback from the record highs of $25.51 reached Saturday, as the bulls regain control after taking a brief breather early Sunday.
The seventh most traded cryptocurrency enjoys a market cap of $9.857 billion, having risen almost 25% over the past seven days. At the press time, the coin hovers around $24.50, reversing a dip to $23.77 lows.
LINK/USD: Bulls look to retest record highs
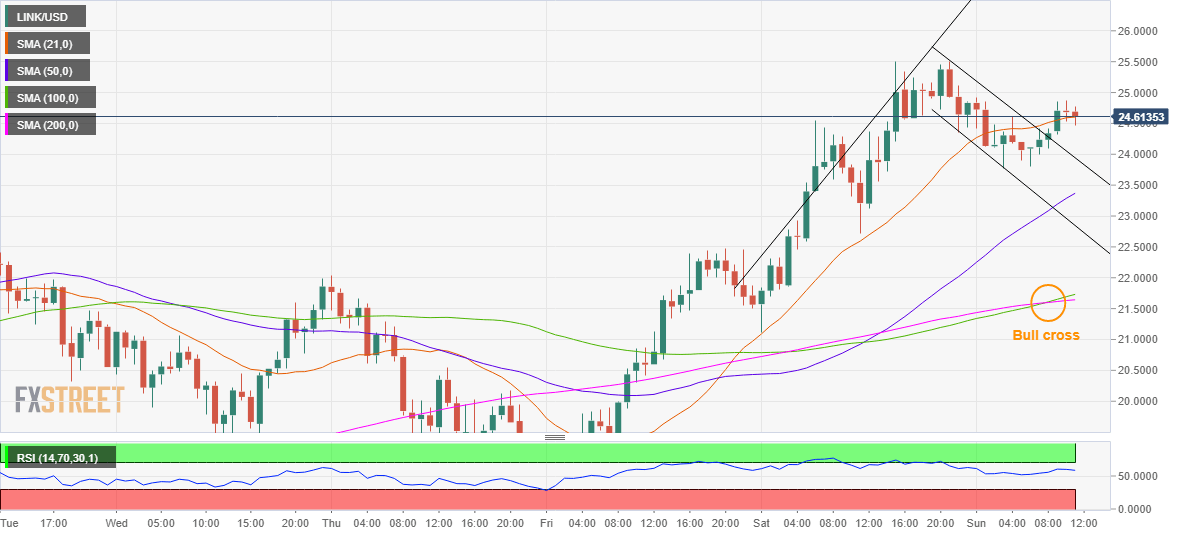
LINK/USD: Hourly chart
LINK/USD has charted a bullish flag breakout on the hourly sticks and battles the 21-hourly moving average (HMA) at $24.60, as of writing.
A sustained move above the latter could drive the pair towards the $25 mark, above which the lifetime high would be retested.
Adding credence to the upside break, the altcoin witnessed a bullish crossover in the last hours after the 100-HMA pierced the 200-HMA from below.
Therefore, the path of least resistance appears to the upside, with the Relative Strength Index (RSI) still holding ground above the positive region, although off the higher levels.
The buyers have the pattern target measured above $28 on their radars.
However, if the correction picks up pace, the price could drop to test the pattern resistance-turned-support at $23.94.
A failure to defend that level could offer extra zest to the LINK bears, with the bullish 50-HMA support at $23.37 likely to challenge their commitment to the downside.
Further south, if the falling trendline (pattern) support at $23.85 caves in, the bullish formation will fail, opening floors for further correction.
Author

Dhwani Mehta
FXStreet
Residing in Mumbai (India), Dhwani is a Senior Analyst and Manager of the Asian session at FXStreet. She has over 10 years of experience in analyzing and covering the global financial markets, with specialization in Forex and commodities markets.



