Can the MATIC price recover after last week's strongest YTD decline?
- MATIC price declined by 14% last week.
- The Relative Strength Index suggests MATIC's uptrend is still intact but close to failing.
- A break above $1.31 could catalyze a challenge of February's monthly high at $1.56.

MATIC price should remain on traders' immediate watchlists as the technicals suggest an unfolding make-or-break situation. Risk management should remain the primary focus while utilizing the key levels mentioned below.
MATIC price in make-or-break situation
MATIC has succumbed to a bearish stronghold as the scalable smart contract token was amongst the top losers last week, falling by 14%. On March 2, the Polygon Network price continues to bear the brunt of profit-taking traders as the price was down 5% to start the week.
MATIC price currently auctions at $1.21. While the bears are undoubtedly in control, the technicals suggest joining the bears could be problematic. The Relative Strength Index (RSI) confirms the need for caution as it reads the current price as a corrective structure within the winter rally, which at its height rallied 109% from the January 1 open at $0.75 into the year-to-date high at $1.56.
The ongoing downtrend will be considered a corrective structure until the RSI breaks below 40. If this event occurs, bears would be justified in an entry as the MATIC price could decline impulsively as low as the $0.77 zone to challenge traders who participated in the early stages of the winter bullrun.
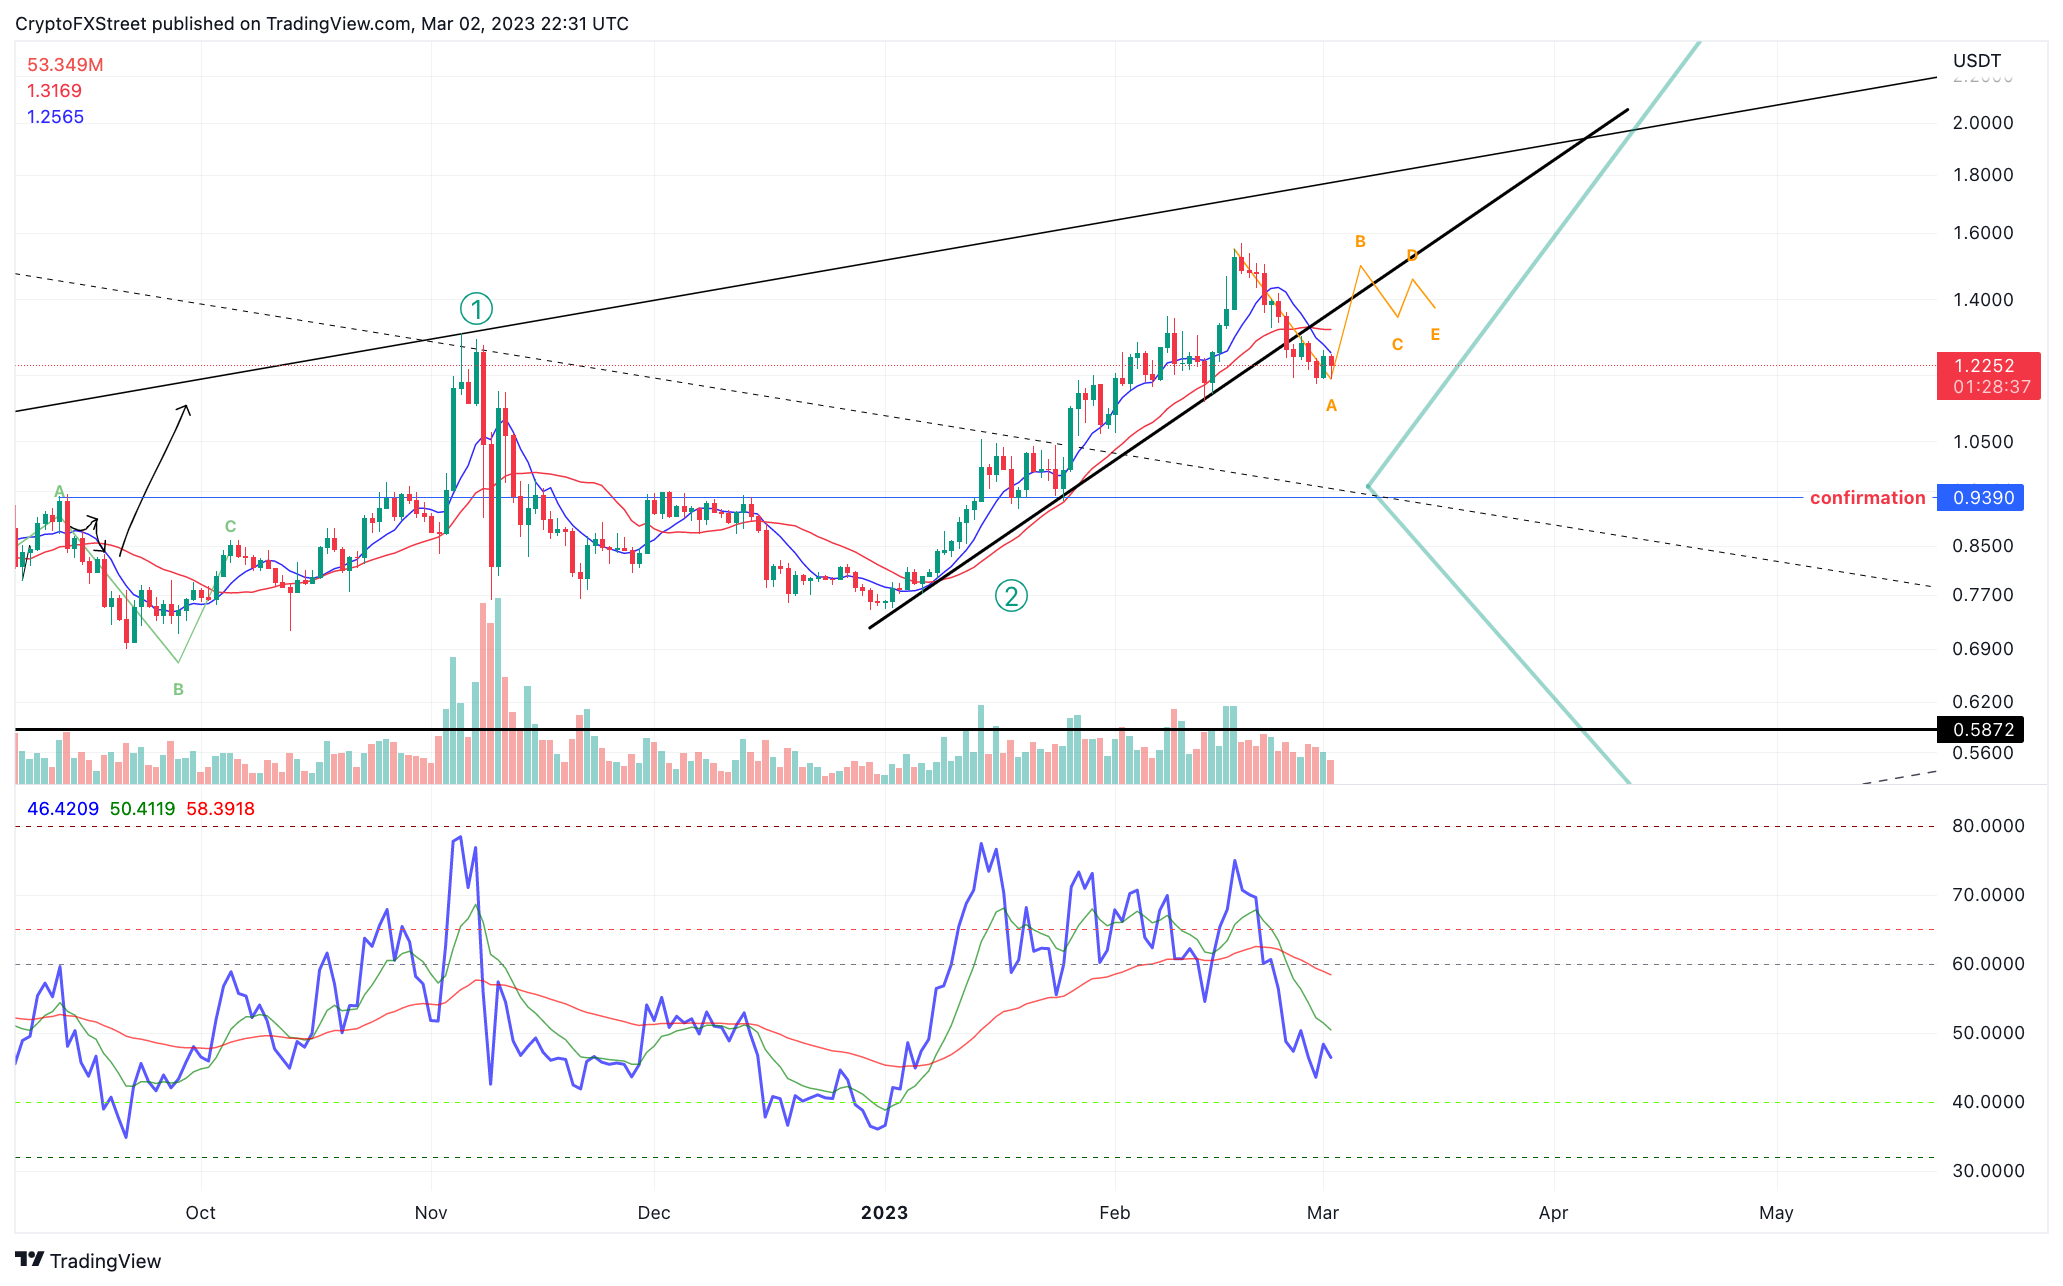
MATIC/USDT 1-Day Chart
Nonetheless, while the RSI hovers above 40, there is always potential for a market reversal. The earliest confirmation to validate that the downtrend is due for a challenge would be a breach above the 21-day simple moving average currently positioned at $1.31. If the hurdle is surpassed, traders could place an entry with an invalidation point below this week's low at $1.18 while aiming for a second pump toward the YTD high at $1.56. The bullish scenario would result in a 29% increase from MATIC current market value.
Author

Tony M.
FXStreet Contributor
Tony Montpeirous began investing in cryptocurrencies in 2017. His trading style incorporates Elliot Wave, Auction Market Theory, Fibonacci and price action as the cornerstone of his technical analysis.


