Bitcoin price could commence a new bull run for these reasons
- Bitcoin price has triggered an unprecedented levell of fear in the market according to the Fear and Greed Index.
- BTC price now shows RSI divergence between two significant levels, which confounds one more bull-run will occur.
- Invalidation of the macro bullish count is a breach at 13,880.

Bitcoin price shows a textbook-like Elliot Wave pattern on the macro count. One more bull-run into $80,000 and above is still in the cards for Bitcoin.
Bitcoin price can still rise to new heights
Bitcoin price reeks of bearish sentiment. Twitter accounts, Telegram chats and Celebrity Influencers have all come out to bash the peer-to-peer digital currency. Fellow analysts who are highly regarded for their previous successes argue with conviction of a $14,000 Bitcoin price in the near future. Is everyone right? or does Bitcoin have one more "shock the world" bullet in the chamber?
Bitcoin price has an alternative count that still remains very bullish. In fact, the technicals for this unpopular wave count suggests that now is the perfect time to begin buying Bitcoin from a dollar-cost average approach. Having a transaction filled during the true bottom of any market is something traders rarely experience in their careers.
Albeit Bitcoin provides textbook-like confluence suggesting the current mudslide, Fed’s hike induced, LUNA rug-pull to blame, downtrend is merely a shallow wave 4 in the grand scheme of things. A Fibonacci retracement tool surrounding the entirety of wave 3 (since the coronavirus lows of 2020 into all-time highs at $69,000) indicates the recently breached $22,910 level as just a 38.2% retracement. Textbook for a shallow wave 4 pattern.

BTC/USDT 1-Week Chart
Keep in mind that the Elliott Wave rule of alteration suggests waves 2 and 4 alternate in retracement percentages. Precisely what was seen during the 70% retracement into $4,435 during March 2020 that this alternative count has marked as a deep wave 2.
Another textbook-like confluence is visible on the Relative Strength Index. Notice the divergence between wave 2 and wave 4. The indicator suggests the current BTC price at $20,910 is more oversold than when the Bitcoin price traded at $4,435 in March 2020.
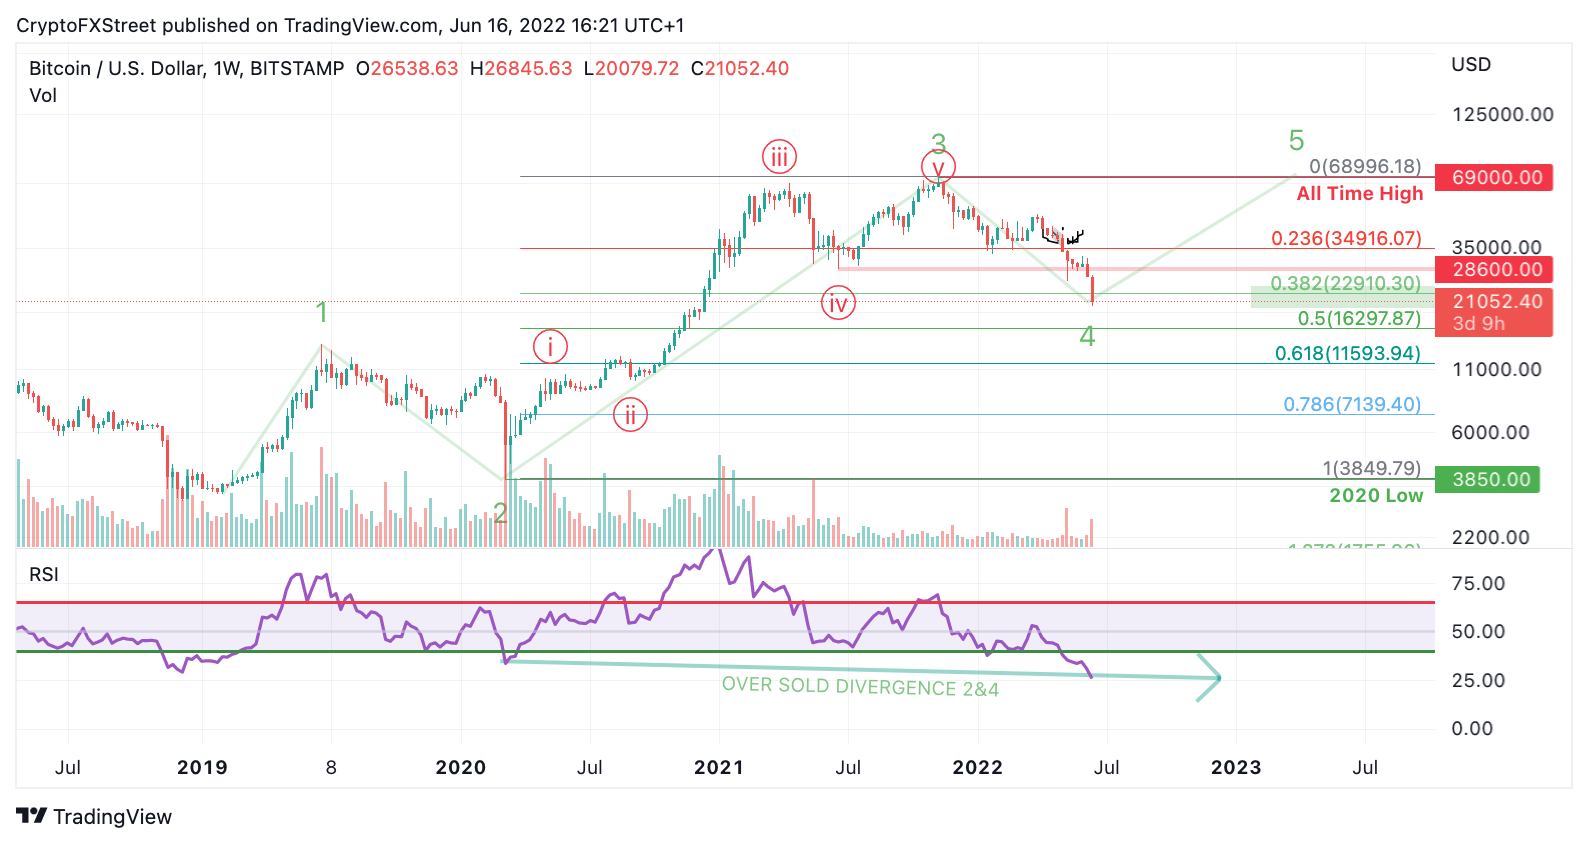
BTC/USDT 1-Week Chart
Last but not least, while Crypto Fear And Greed Index has printed the highest historical sentiment fear reading to date, the Bitcoin price has just retested the Elliott Wave parallel trend channel for the first time in history. When combined, the stars could be aligning in favor of the Bitcoin price to make one more bull-run. Conventional targets at $69,000 to mitigate the all-time high, price discovery projections in the $80,000 region, and FOMO-induced madness could fuel the bullish flame for a lot more.
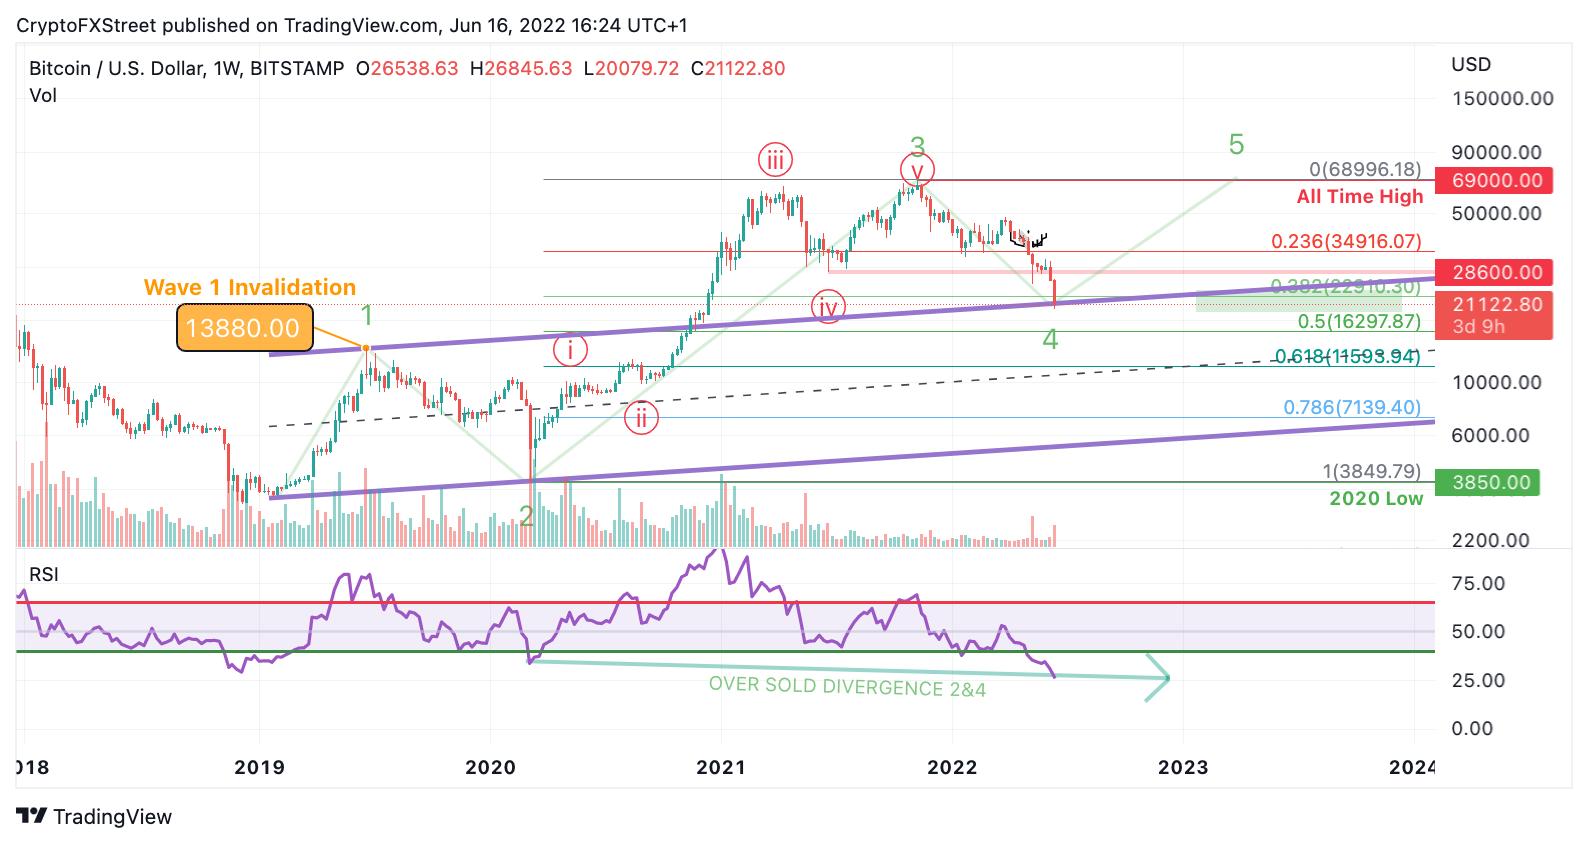
BTC/USDT 1-Week Chart
Invalidation of the entire macro count for Bitcoin price is now 35% below current market value at $13,880. If $13,880 is breached, it's over. Everyone else was right, and Armageddon is here. Bitcoin price will see a fatal demise towards $10,000 and possibly $4,000, resulting in an 80% decline from the current BTC price.
Author

Tony M.
FXStreet Contributor
Tony Montpeirous began investing in cryptocurrencies in 2017. His trading style incorporates Elliot Wave, Auction Market Theory, Fibonacci and price action as the cornerstone of his technical analysis.


