Can Bitcoin price dip lower? This is the support level traders are watching carefully
- Bitcoin price has marked a new yearly low.
- Bitcoin price shows significant bearish volume interest on the 8-hour chart.
- Invalidation of the downtrend is a breach above $25,500.

Bitcoin price reacquaints 2020 areas of interest as bear press $23,000. Increased volatility is likely to occur in the coming days.
Bitcoin price revisits nostalgia
Bitcoin price has experienced a devastating decline to start this week’s trading session. BTC price is now consolidating in an uncertain spot. The steep decline has breached all short term bullish ideas and will likely steer traders away from buying too soon. The bears have successfully pushed the price into levels unseen since 2020. If this is the final low for Bitcoin, smart money will certainly create a zone in order to accumulate large orders of the peer-to-peer digital currency.
Bitcoin price currently trades at $23,700. The bears have established 2 strong engulfing candles on the 8-hour chart accompanied with an immense influx of volume. The Relative Strength Index has a significant low in the vicinity of the current price action dating back to 2019. Bitcoin’s reaction to this key RSI level could be an early market bottom indicator if market conditions continue to push the BTC price in such a free-fall manner.
Bitcoin price hovers inches above the 200- week average. This provides further confluence of a zone to form in the current $23,000 price level. If the 200- week moving average fails to provide support, expect an armageddon style collapse into the 2017 highs at $19,798.
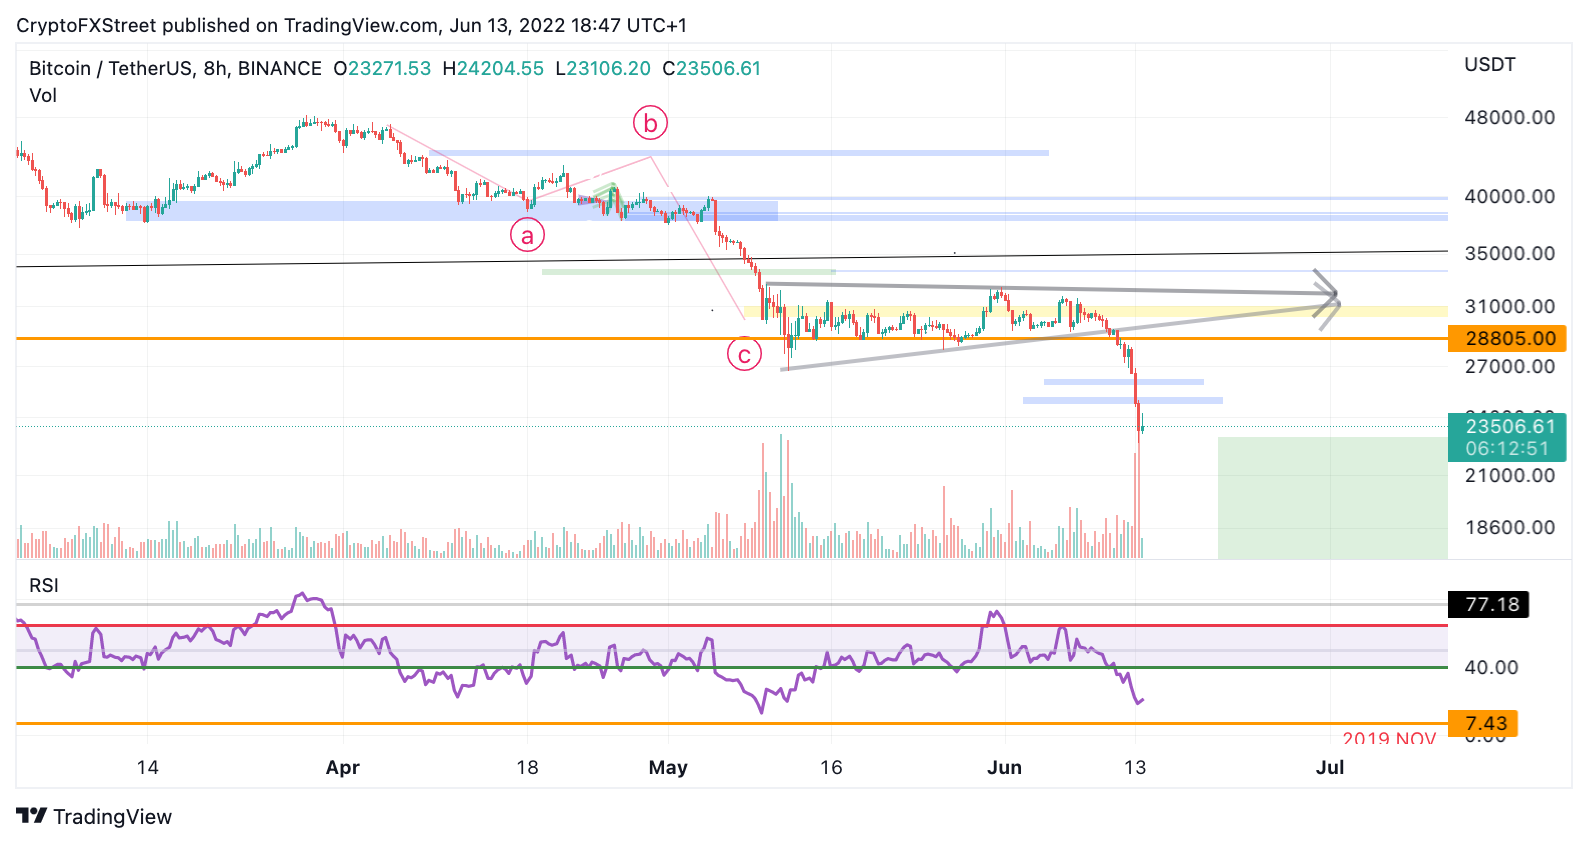
Bitcoin/USDT 8-Hour Chart
A risky invalidation level could be a break and close above $25,500. A break above this level could send prices back towards $28,000 which would relay a 20% increase from the current Bitcoin price.
Author

Tony M.
FXStreet Contributor
Tony Montpeirous began investing in cryptocurrencies in 2017. His trading style incorporates Elliot Wave, Auction Market Theory, Fibonacci and price action as the cornerstone of his technical analysis.