These three metrics suggest the Bitcoin price crash is not over

Bitcoin (BTC) near $20,000 is worrying the market, but after narrowly avoiding breaking support, is the worst really over?
According to multiple on-chain indicators, it seems that max pain has yet to arrive this cycle.
The stakes are high for many hodlers this week — almost 50% of the supply is being held at a loss and miners are upping their shipments of BTC to exchanges.
Even some of Bitcoin’s biggest investors, notably MicroStrategy, are having to defend their conviction on BTC as price action tumbles.
With targets ranging as low as $11,000, Cointelegraph takes a look at how much further the market technically needs to drop to match historical bottom zones.
Weak hodlers still to be flushed out
Despite the drop to eighteen-month lows, Bitcoin price action has not yet shaken out all its speculators. According to the RHODL Ratio from Philip Swift, creator of on-chain analytics resource LookIntoBitcoin, more capitulation should be on the way.
This is because historically, the ratio between short-term and long-term hodlers has been more in favor of the latter at macro price bottoms.
RHODL specifically takes the ratio between the 1-week and the 1-2 year cohorts of the Realized Cap HODL Waves metric, which divides coins by when they last moved (weighted by realized price).
Essentially, once RHODL’s green zone is it, it suggests that capitulation is at its peak and that a price floor is imminent or already being set. So far, RHODL has yet to enter its green zone, data from on-chain analytics firm Glassnode shows.
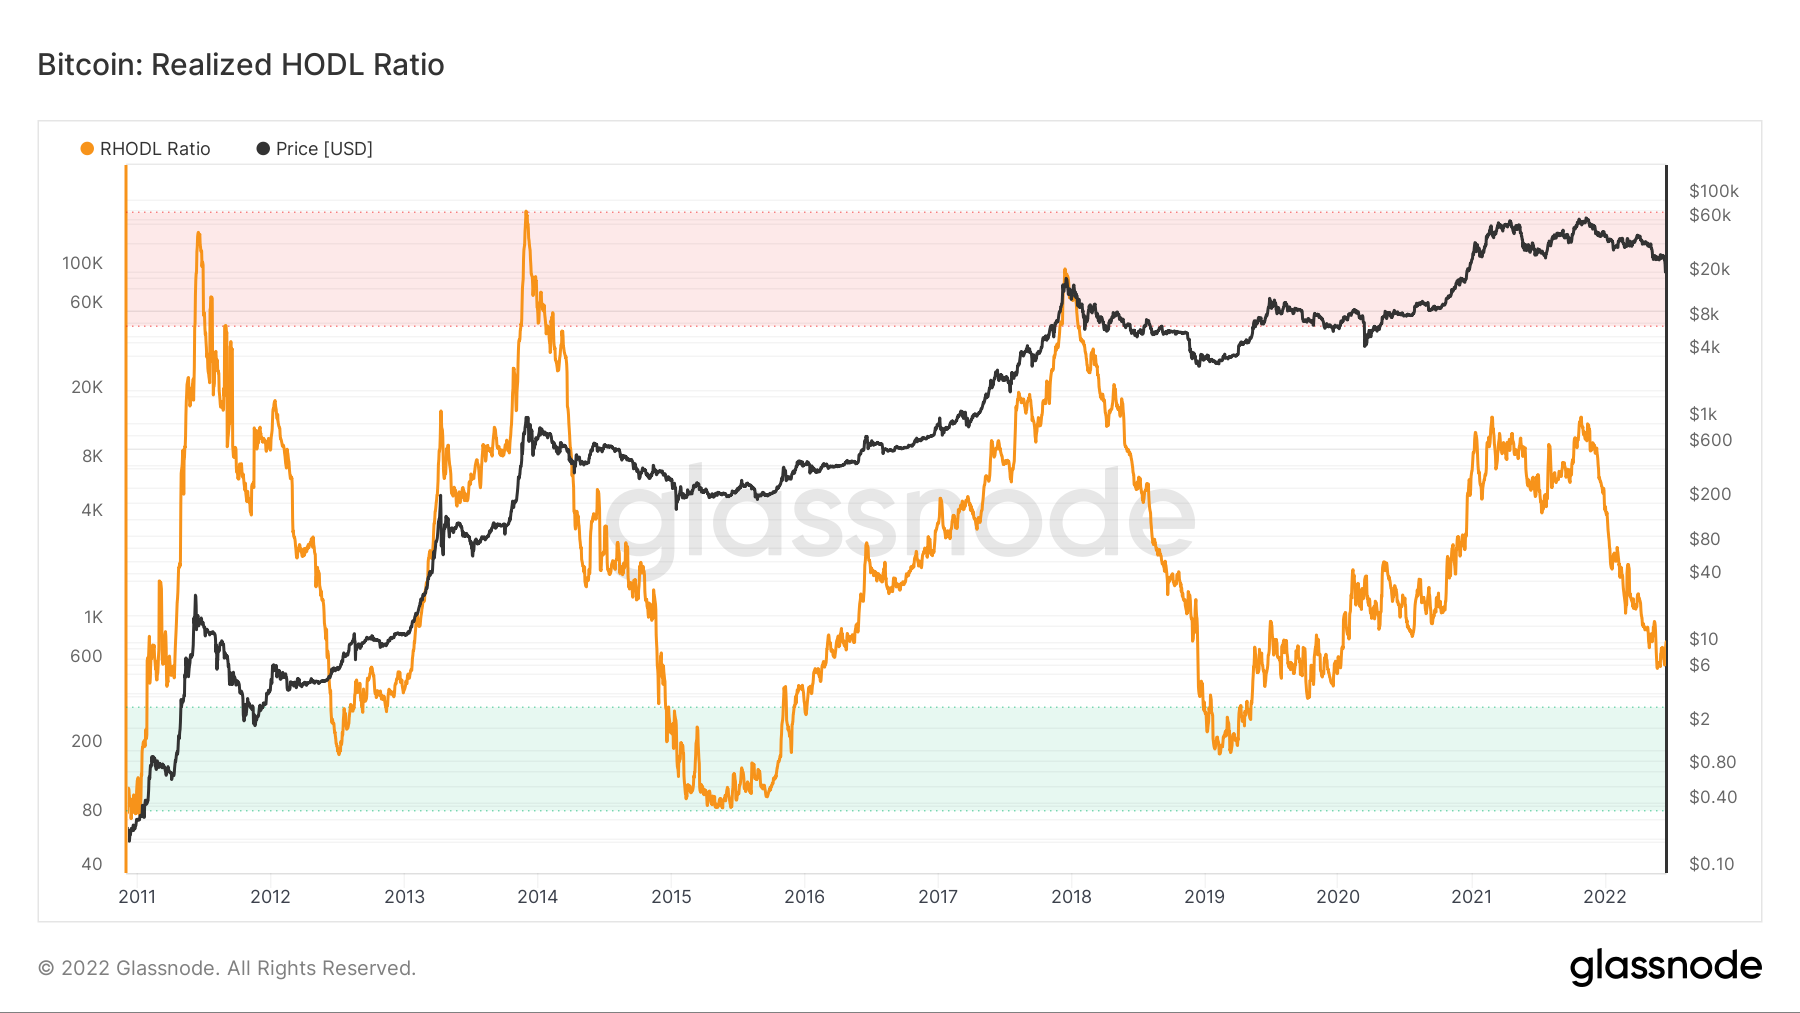
Bitcoin RHODL Ratio chart. Source: Glassnode
Not enough hodlers are underwater
It may feel like the entire Bitcoin market is at a loss, but above $20,000, many are still holding onto what are likely meager gains, hoping for a rebound.
Fellow on-chain analytics platform CryptoQuant reveals that as of June 16, just 46% of the total BTC supply is being held at a loss.
This is impressive as a statistic in itself but not enough to call a macro capitulation event if historical patterns are taken into account.
According to CryptoQuant data, at least 60% of the supply needs to generate unrealized losses before it can be called capitulation — as was the case in March 2020, late 2018 and earlier.
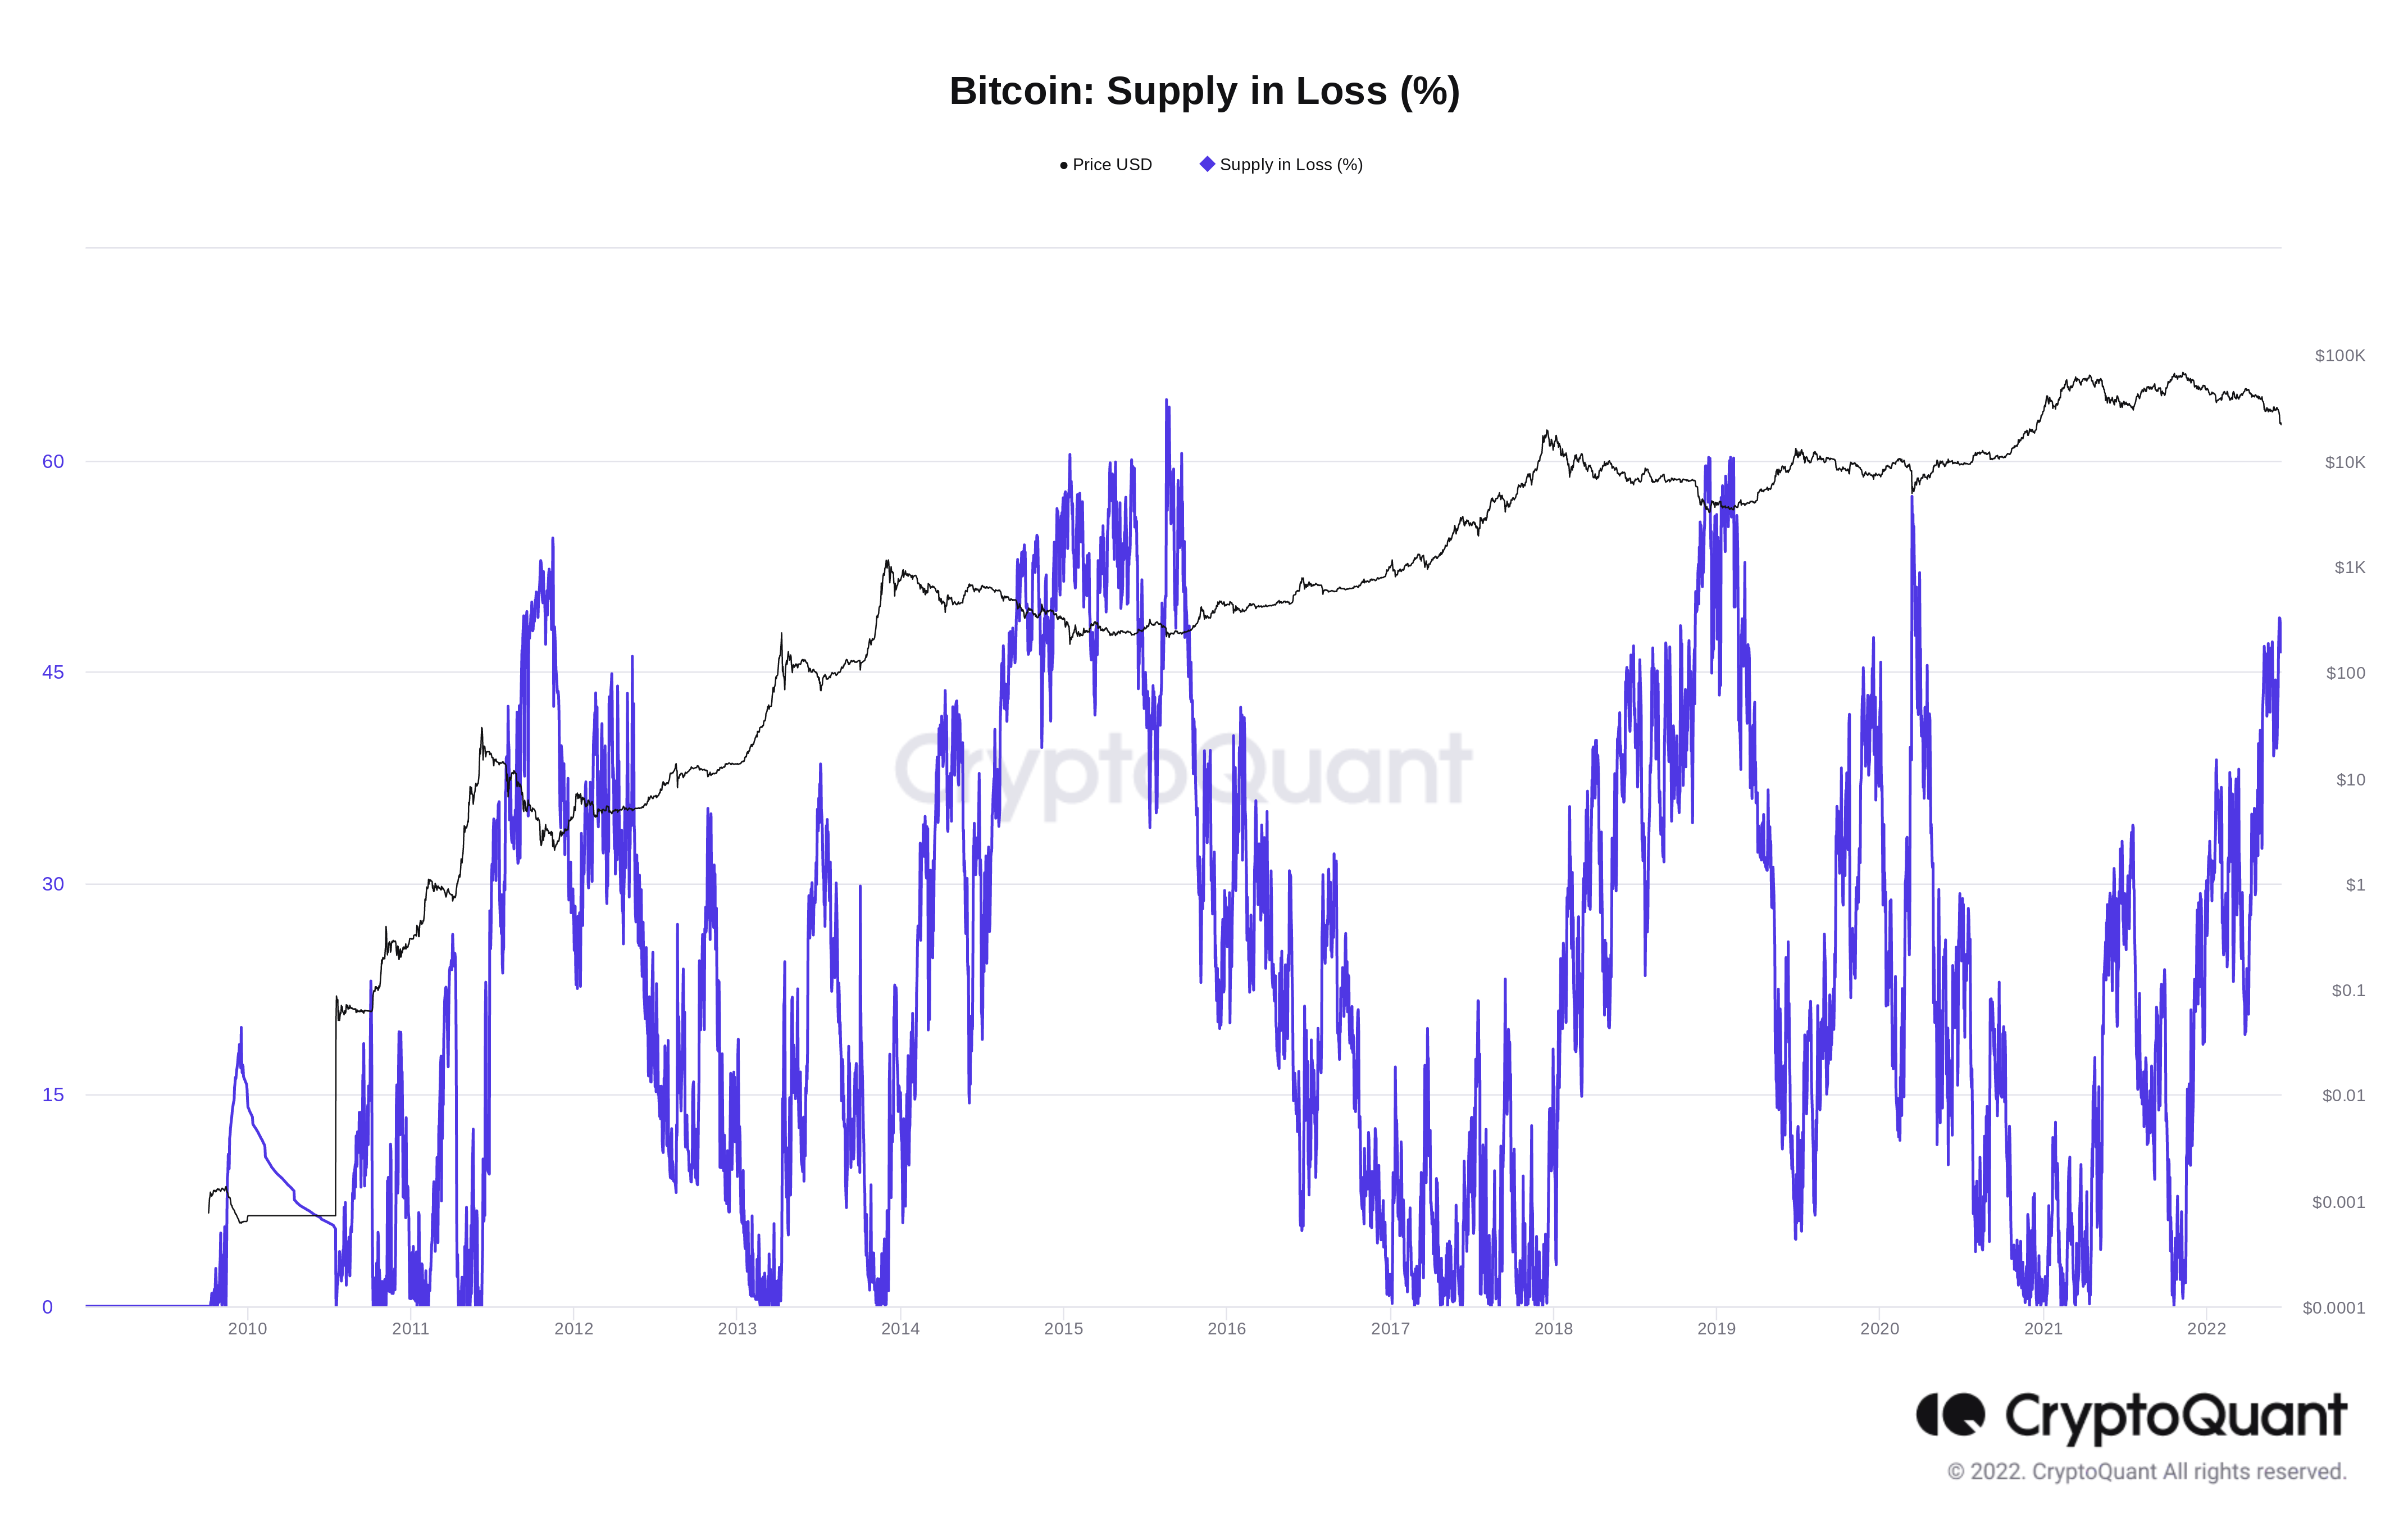
Bitcoin percentage of supply in loss chart. Source: CryptoQuant
CryptoQuant CEO Ki Young Ju noted the significance of BTC/USD returning to its realized price last week. This event, two years in the making, signifies spot price going under the average price at which all coins last moved.
“Been waiting for this moment for 2 years since the great sell-off in March 2020,” he commented at the time.
No surrender for miners despite “impressive” exchange flows
Despite their production cost likely being closer to $30,000 than $20,000, Bitcoin miners have yet to start covering expenses with sales of hoarded BTC. Coins are moving to exchanges, however, at the highest rate in seven months, Cointelegraph recently reported.
As such, the Bitcoin network hash rate has not taken a serious dive yet, something common during periods of significant price pressure.
The Hash Ribbons metric, created by asset manager Capriole CEO Charles Edwards, confirms the lack of trend.
Hash Ribbons use the 30-day and 60-day moving average of hash rate to determine when miner capitulation is occurring. Once the rising 30-day crosses above the 60-day, it can be assumed that the “worst” is over as miners return to work.
So far, that crossover is yet to happen, and historically, this means that max pain could lie ahead.
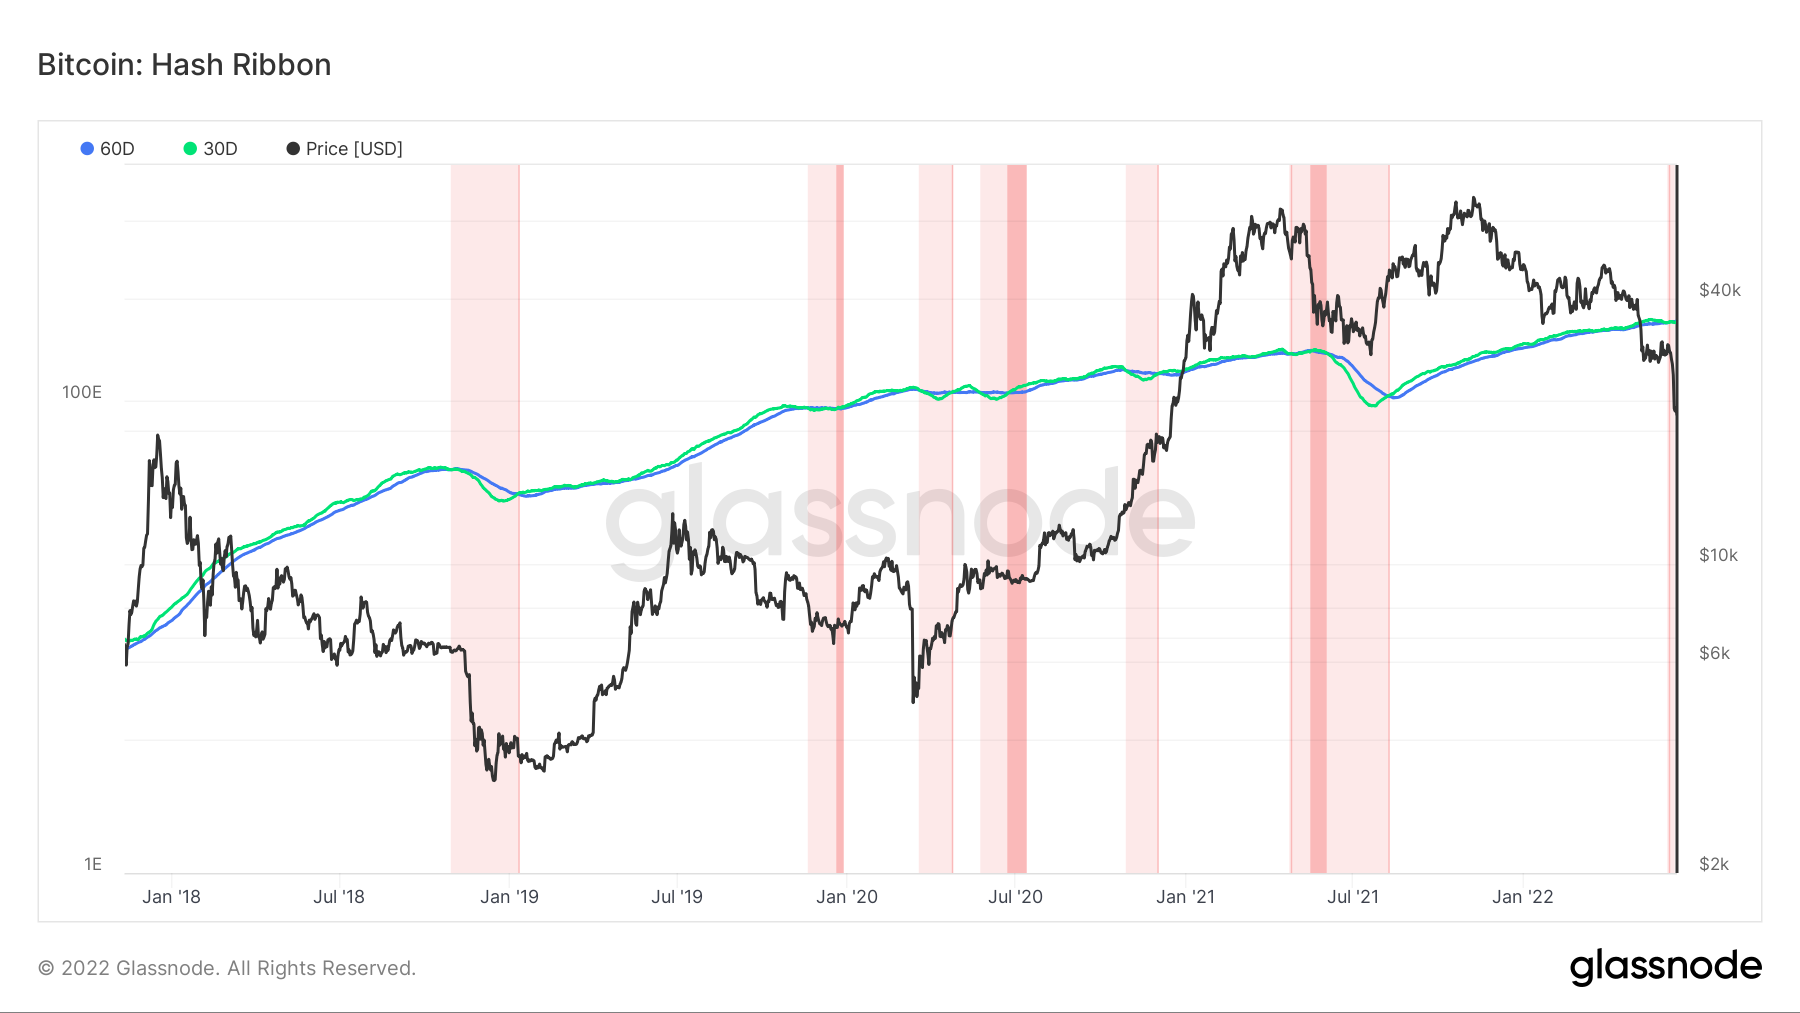
Bitcoin Hash Ribbons chart. Source: Glassnode
“Impressive bitcoin miner exchange flows,” economist, trader and entrepreneur Max Krueger, meanwhile, commented about miner activity this week:
Many miners would be in deep trouble with $BTC in the teens, panicking yesterday in anticipation of 20k breaking makes sense.
Author

Cointelegraph Team
Cointelegraph
We are privileged enough to work with the best and brightest in Bitcoin.


