Bitcoin Cash Price Forecast: BCH imminent dump eyes price levels under $200 – Confluence Detector
- Bitcoin Cash could dive massively to levels under $200, mostly if a descending triangle breakdown is confirmed.
- The confluence support at $258 and $257 could help Bitcoin Cash reclaim support at $260.

Bitcoin Cash is still engulfed in selling pressure despite the recently established support at $260. All recovery attempts have been in vain. BCH has been forced to seek a lower anchor before recovery comes into the picture. Besides, a bearish pattern on the 4-hour chart points towards a possible breakdown under $200.
Bitcoin Cash overhead pressure could intensify
A daily close under $260 is likely to trigger more sell orders. Traders would also move swiftly to short the cryptoasset if it confirms a breakdown below the horizontal line, forming part of the descending triangle pattern. The chart pattern is a bearish indicator, as explained earlier in the day.
The only formidable support below $260 holds the ground at $240. On the other hand, the triangle has a breakdown target of $194, representing a 25% downswing.
%20(52)-637432627573560336.png)
BCH/USD 4-hour chart
Meanwhile, sideways trading, as reinforced by the Relative Strength Index, seems to be calling for stability in the market. This also means that Bitcoin Cash could settle for consolidation before the next significant move.
The confluence detector shows that Bitcoin Cash's downside is protected by robust support at $258. Here, the 1-hour Bollinger Band lower boundary and the one-week pivot point support one converge. Another medium support is highlighted at $257 by the one-hour previous low and the 15-minutes Bollinger Band lower border.
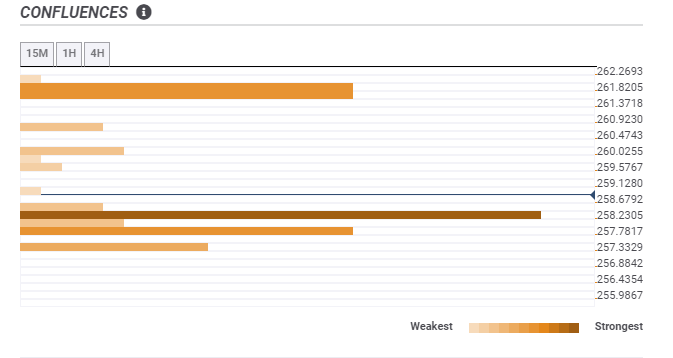
BTC/USD confluence levels
The token has some leeway for growth on the upside, at least enough to reclaim the position above $260. However, bulls must prepare to deal with the intense seller congestion between $261.4 and $261.8. The one-day previous low and the one-day pivot point support one.
Author

John Isige
FXStreet
John Isige is a seasoned cryptocurrency journalist and markets analyst committed to delivering high-quality, actionable insights tailored to traders, investors, and crypto enthusiasts. He enjoys deep dives into emerging Web3 tren




