Bitcoin Cash Price Analysis: BCH eyes massive losses if crucial support breaks – Confluence Detector
- Bitcoin Cash bulls must hold firmly to the confluence support at $291 to avert potential losses.
- Two of the TD Sequential indicator's sell signals on the 4-hour and 12-hour charts have already been validated.

Bitcoin Cash has been rejected from the monthly peak at $373. The massive breakdown overshot tentative support levels above $300, culminating in losses as far as $272. Although the bearish momentum appears to have slowed down, a break under the confluence indicator's critical support level might further extend the bearish leg.
Bitcoin cash downtrend gains traction
At the time of writing, Bitcoin Cash is trading at $290. A minor recovery has ensued after BCH bounced off the critical support at the 100 Simple Moving Average on the 4-hour chart. For now, BCH/USD is holding at the 50 SMA while struggling to sustain the uptrend.
Losses are likely to send Bitcoin Cash spiraling if the immediate support at the 50 SMA caves. The bearish outlook is reinforced by the Relative Strength Index, following a sharp fall from the overbought area. Bitcoin Cash could explore levels at 100 SMA and perhaps retest the congestion at $260.
 (49)-637419702666270894.png)
BTC/USD 4-hour chart
According to the confluence detector tool, Bitcoin Cash is sitting right at the most robust support zone. The buyer congestion at $291 has been highlighted by the one-month pivot point resistance one. A slide under this zone is likely to validate the bearish outlook and perhaps give way for losses eyeing $272 and $260, respectively.
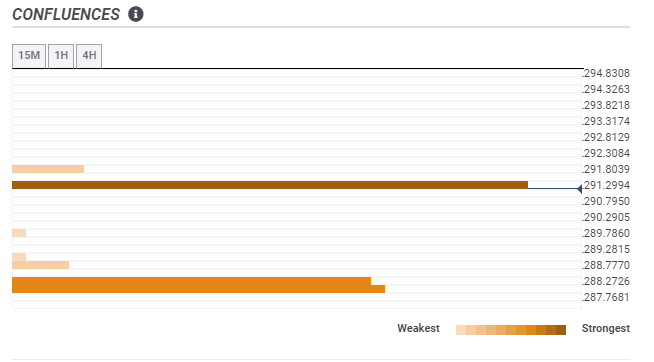
BCH/USD confluences chart
A glance at the 4-hour and 12-hour charts show the TD Sequential Indicator has already presented sell signals that have been validated. The signals manifested in green nine candlesticks, calling for more sell orders and explaining BCH's drop from $373 to $272.
On the other hand, the indicator is likely to present another sell signal on the daily chart in the coming sessions. If validated, Bitcoin Cash could resume the downtrend to the initial crucial support at $272. Moreover, extended losses would seek refuge at $260 to avert dire losses towards $200.
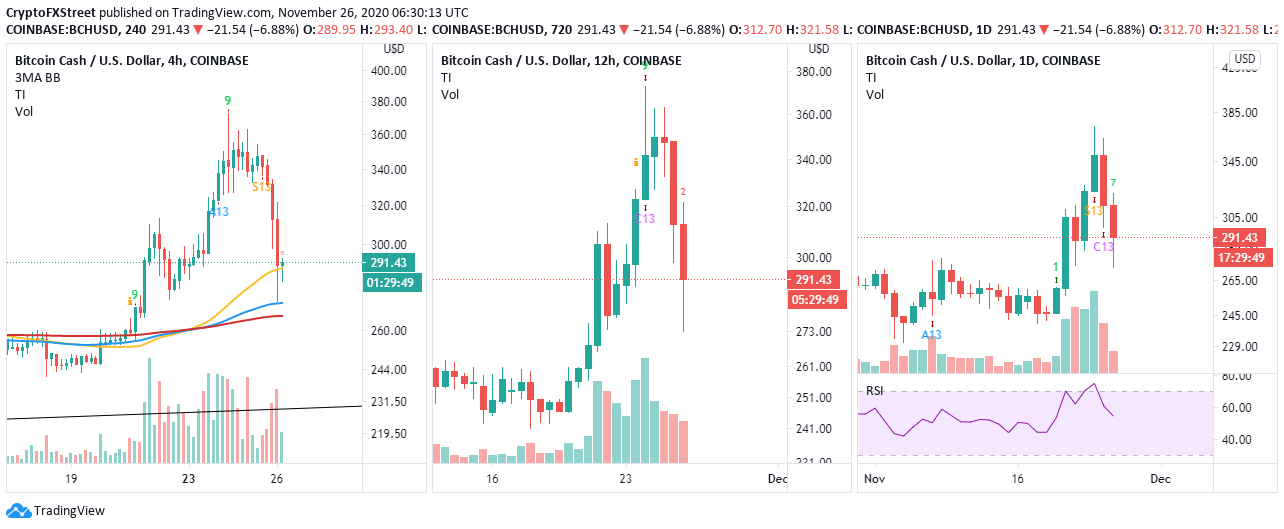
BCH/USD 4-hour, 12-hour, and daily charts
It is worth mentioning that the confluence detector brings to light medium-strong support $288. The indicators converging here include the SMA ten 15-minutes, the SMA 50 4-hour, and the daily pivot point support one. Holding above this support could call for stability and consolidation, giving bulls some time to plan the next attack mission for gains above $300.
Author

John Isige
FXStreet
John Isige is a seasoned cryptocurrency journalist and markets analyst committed to delivering high-quality, actionable insights tailored to traders, investors, and crypto enthusiasts. He enjoys deep dives into emerging Web3 tren




