Cardano Price Prediction: ADA eyes a 25% downswing if this bearish pattern confirms


  • Cardano is dancing at the extreme edge of a cliff, likely to fall to price levels under $0.1.
  • A buy signal could appear on the 4-hour chart in the coming sessions, thereby invalidating the bearish outlook.

Cardano is trading in the red, just like other major cryptocurrencies. The smart contract token recently slumped to $0.13 as precisely predicted. A minor recovery seems to have come into the picture but failed to gain momentum. As technical levels continue to dwindle, ADA seems poised for a further breakdown under $0.1.

Cardano likely to dump some more under $0.1

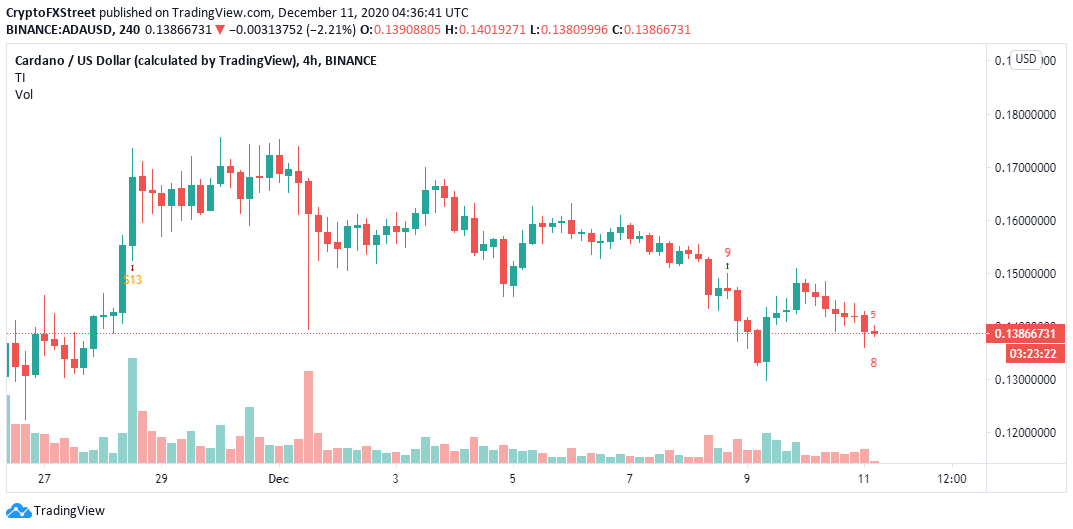
ADA is trading at $0.139 after suffering yet another rejection under the descending trendline. The same upside is also limited by the 50 Simple Moving Average and the 100 SMA on the 4-hour chart.

Marginally under the current price level, Cardano is anchored on the 200 SMA. The buyer congestion at this zone must remain intact to avert potential losses. Besides, the Relative Strength Index downward slope adds credence to the bearish narrative. Note that ADA/USD is also near the apex of a descending triangle pattern.

Descending triangle patterns are bearish and usually lead to massive losses. Traders watch out for breaks under the horizontal line connecting a series of lows. They then enter into short positions, further adding pressure on the asset. The current triangle pattern hints at a 25% downswing to levels slightly under $0.1.

ADA/USD 4-hour chart

ADA/USD 4-hour chart

The TD Sequential is likely to present a buy signal on the 4-hour chart, which could invalidate the technical breakdown. The call to sell will manifest in a red nine candlestick. If the bearish outlook is confirmed, Cardano could rise in one to four daily candlesticks.

ADA/USD 4-hour chart

ADA/USD 4-hour chart

Similarly, a bullish picture will appear if ADA holds above the 200 SMA. On the upside, a spike above the trendline could call for more buy orders, creating enough volume for a breakout to $0.18. Note that the 50 SMA and the 100 SMA could delay the recovery process.


Information on these pages contains forward-looking statements that involve risks and uncertainties. Markets and instruments profiled on this page are for informational purposes only and should not in any way come across as a recommendation to buy or sell in these assets. You should do your own thorough research before making any investment decisions. FXStreet does not in any way guarantee that this information is free from mistakes, errors, or material misstatements. It also does not guarantee that this information is of a timely nature. Investing in Open Markets involves a great deal of risk, including the loss of all or a portion of your investment, as well as emotional distress. All risks, losses and costs associated with investing, including total loss of principal, are your responsibility. The views and opinions expressed in this article are those of the authors and do not necessarily reflect the official policy or position of FXStreet nor its advertisers. The author will not be held responsible for information that is found at the end of links posted on this page.

If not otherwise explicitly mentioned in the body of the article, at the time of writing, the author has no position in any stock mentioned in this article and no business relationship with any company mentioned. The author has not received compensation for writing this article, other than from FXStreet.

FXStreet and the author do not provide personalized recommendations. The author makes no representations as to the accuracy, completeness, or suitability of this information. FXStreet and the author will not be liable for any errors, omissions or any losses, injuries or damages arising from this information and its display or use. Errors and omissions excepted.

The author and FXStreet are not registered investment advisors and nothing in this article is intended to be investment advice.

Join Telegram

Recommended content


Recommended Content

Editors’ Picks

Dogwifhat price pumps 5% ahead of possible Coinbase effect

Dogwifhat price pumps 5% ahead of possible Coinbase effect

Dogwifhat (WIF) price recorded an uptick on Thursday, going as far as to outperform its peers in the meme coins space. Second only to Bonk Inu (BONK), WIF token’s show of strength was not just influenced by Bitcoin (BTC) price reclaiming above $63,000.

More Dogwifhat News

Runes likely to have massive support after BRC-20 and Ordinals frenzy

Runes likely to have massive support after BRC-20 and Ordinals frenzy

PUPS, WZRD, and PEPE are gaining liquidity through Bitcoin Ordinals. Creator of Bitcoin’s Ordinals protocol is debuting a new fungible token standard to rival BRC-20, Runes.

More Cryptocurrencies News

Ethereum shows firm support at key level as its correlation with US indices increase

Ethereum shows firm support at key level as its correlation with US indices increase

Ethereum's price continued a sideways movement on Thursday as the market still awaits a trigger. Ethereum isn't alone in this horizontal trend; several major index funds have also traded sideways.

More Ethereum News

Mango Market attacker convicted of fraud and market manipulation

Mango Market attacker convicted of fraud and market manipulation

Mango Market attacker Avi Eisenberg was convicted by a federal jury on Thursday for "fraudulently obtaining" funds from the Solana-based decentralized exchange (DEX). He could face up to 20 years in prison for his role in the $110 million attack.

More Cryptocurrencies News

Bitcoin: BTC’s rangebound movement leaves traders confused

Bitcoin: BTC’s rangebound movement leaves traders confused

Bitcoin (BTC) price has been hovering around the $70,000 psychological level for a few weeks, resulting in a rangebound movement. This development could lead to a massive liquidation on either side before a directional move is established. 

Read full analysis

BTC

ETH

XRP