Altcoins LINK, AVAX and LTC Price Prediction: Double-digit gains ahead
- Chainlink price bounced off the key support level at $22.56, suggesting a rally ahead.
- Avalanche price found support around its 61.8% Fibonacci retracement at $32, gearing up for a surge.
- Litecoin price held its 50-day EMA at $112, heading toward a potential rally.

Altcoins Chainlink (LINK), Avalanche (AVAX) and Litecoin (LTC) prices found support around key levels earlier this week. Their technical outlook shows a bullish picture and hints at double-digit gains ahead.
Chainlink bulls aiming for levels above $30
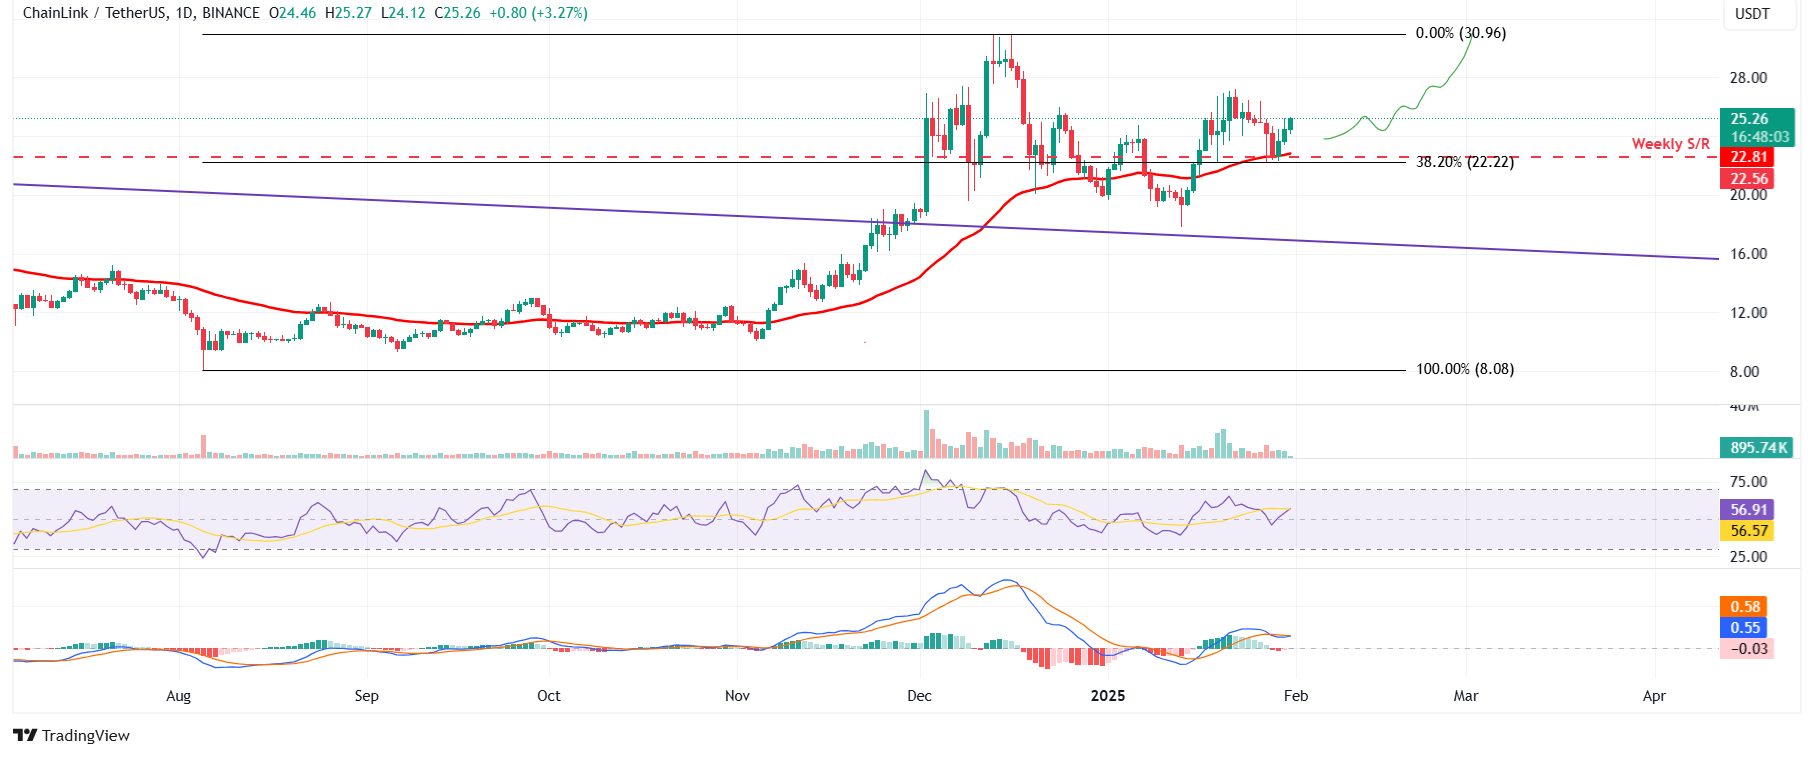
Chainlink price retested, found support around the weekly support level of $22.56 on Tuesday, and rallied 8.13% until Thursday. This level coincides with two important support levels: the 50-day Exponential Moving Average (EMA) and the 38.2% Fibonacci retracement (drawn from the August 5 low of $8.08 to the December 16 high of $30.96), making it a key support zone. At the time of writing on Friday, it continues to trade higher by 3.27% at $25.26.
If LINK continues its upward momentum, it will extend the rally by 23% from its current level to test its December 16 high of $30.96.
The Relative Strength Index (RSI) reads 56, above its neutral level of 50 and pointing upwards, indicating bullish momentum. If the Moving Average Convergence Divergence (MACD) flips to a bullish crossover on the daily chart, it would give a buy signal and suggest an uptrend.
LINK/USDT daily chart
Avalanche price action looks promising
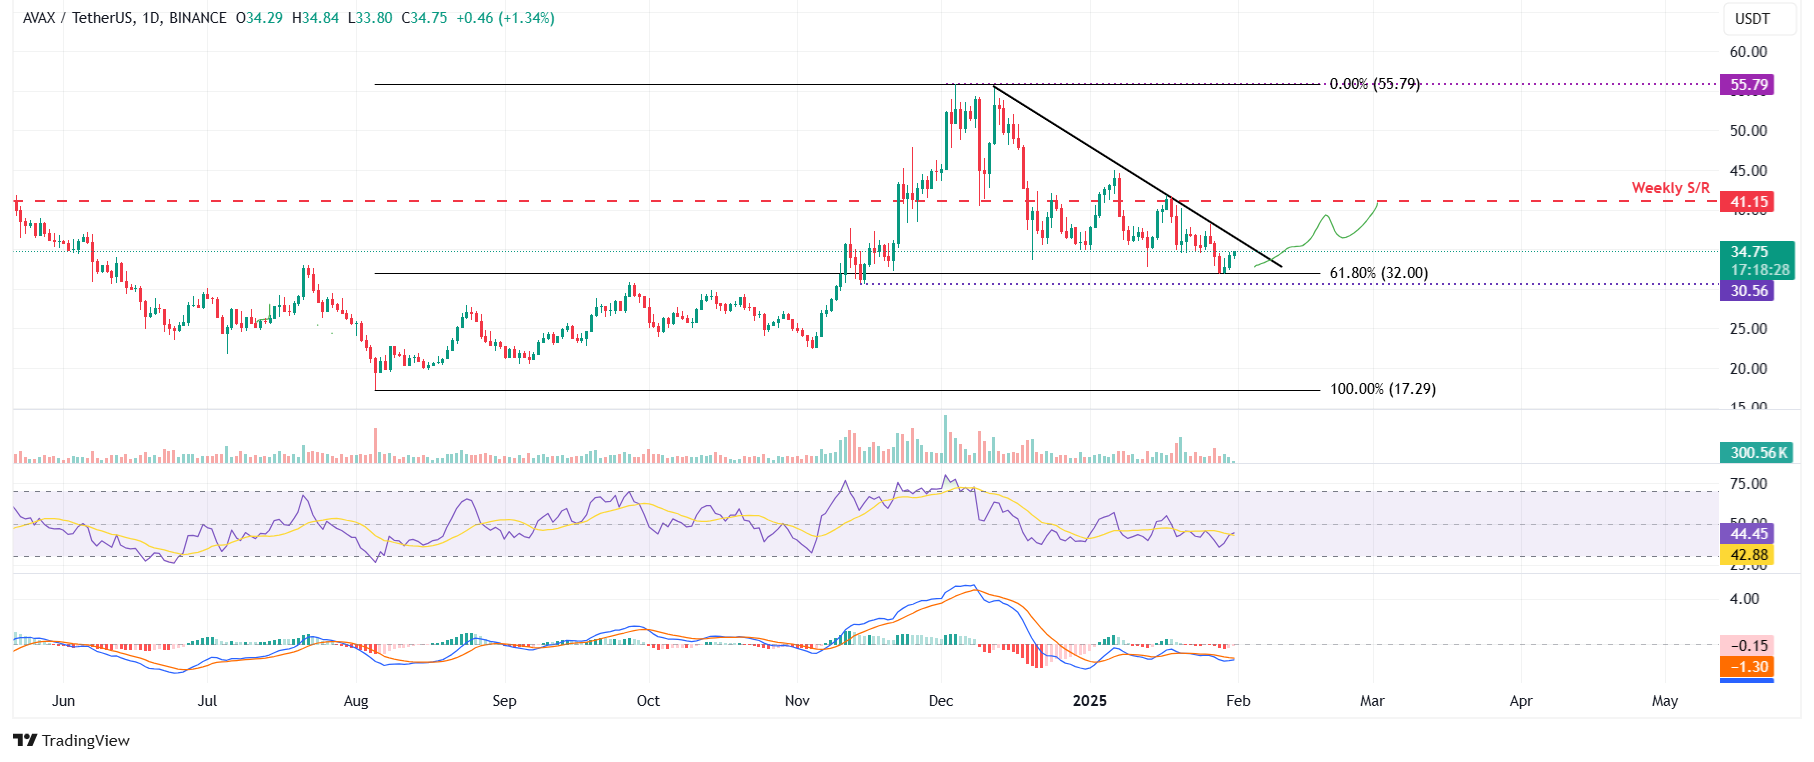
Avalanche price was rejected after testing a descending trendline (drawn by connecting multiple highs since mid-December) on Sunday and declined 12.3% until Tuesday. However, on Wednesday, it found support at its 61.8% Fibonacci retracement (drawn from the August low of $17.29 to the December high of $55.79) at $32 and recovered nearly 7% until Thursday. At the time of writing on Friday, it continues to recover, trading around $34.75.
If AVAX continues its recovery and breaks above the descending trendline, it could extend the rally to retest its weekly resistance level at $41.15.
However, the RSI reads 44 and points upwards. For the bullish momentum to sustain, the RSI must close above the neutral level of 50 and rise. Like Chainklink, AVAX’s MACD indicator on the daily chart is about to flip a bullish crossover. If it succeeds on a daily basis, it would give a buy signal and suggest an uptrend.
AVAX/USDT daily chart
Litecoin bulls aiming for double-digit gains
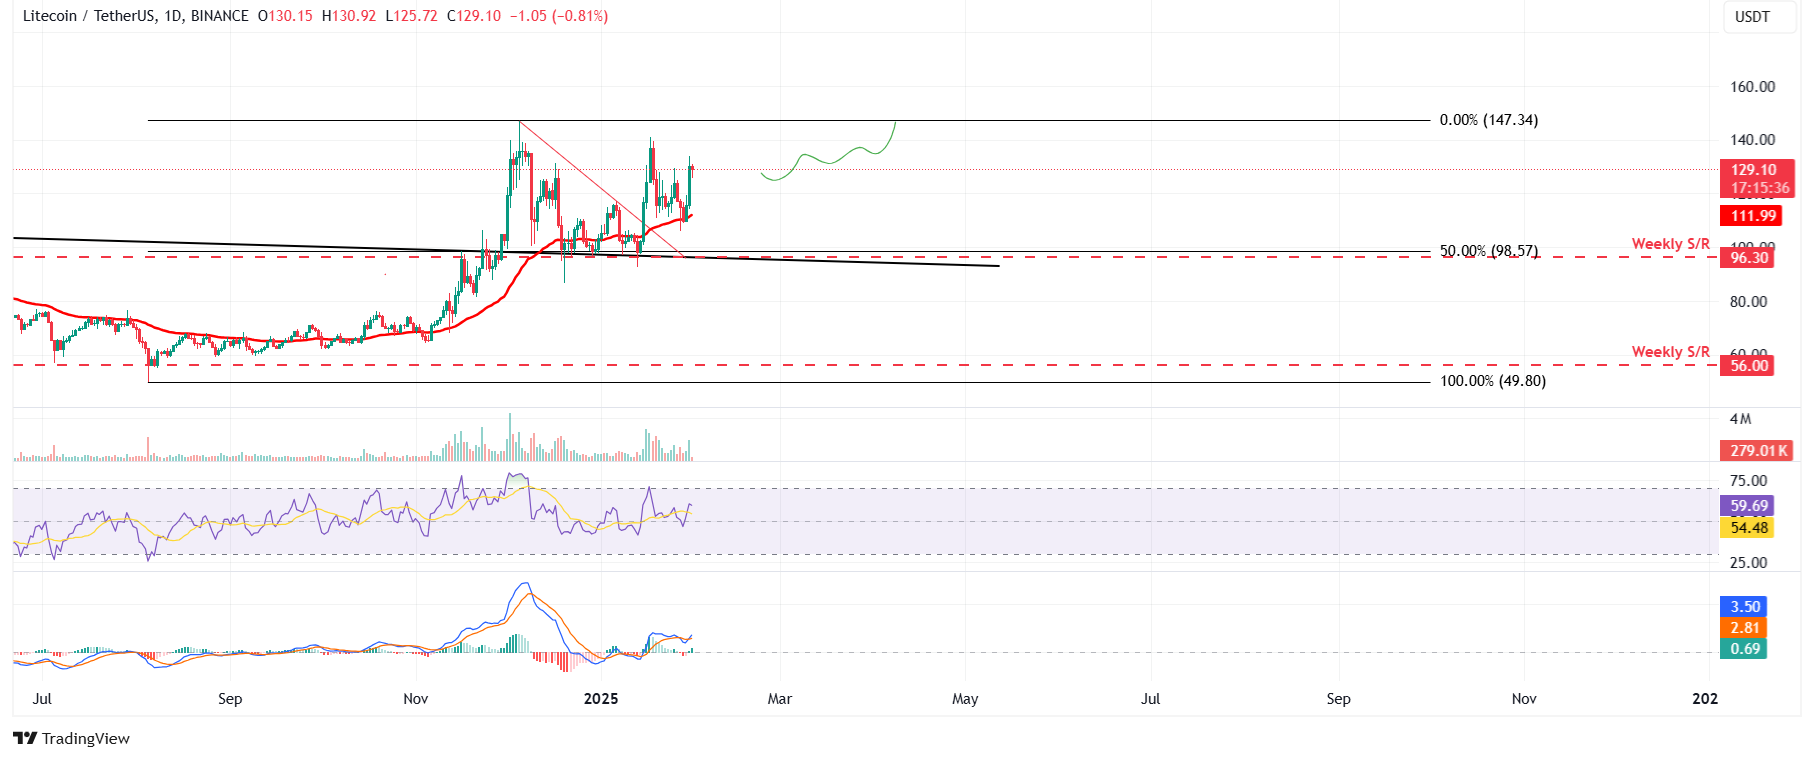
Litecoin price found support around its 50-day EMA at around $112 on Tuesday and rallied more than 18% in the next two days. At the time of writing on Friday, it hovers around $129.10.
If LTC maintains its upward trend, it will extend the rally by 14% from its current level to retest its December 5 high of $147.34.
The RSI reads 59 and points upwards, indicating bullish momentum. Moreover, the MACD indicator on the daily chart shows a bullish crossover on Thursday, giving a buy signal and suggesting an uptrend.
LTC/USDT daily chart
Author

Manish Chhetri
FXStreet
Manish Chhetri is a crypto specialist with over four years of experience in the cryptocurrency industry.



