Stellar Price Prediction: XLM bulls aim for 110% rally
- Stellar price hovers around $0.40 on Thursday after falling 3.4% in the last two days.
- An upward resolution of a symmetrical triangle would open a target at $0.84.
- A daily candlestick close below $0.35 would invalidate the bullish thesis.

Stellar’s (XLM) price hovers around $0.40 on Thursday after falling by 3.4% in the last two days. The technical outlook shows the formation of a symmetrical triangle if it breaks above the target at the $0.84 level, which is 110% of its current trading levels.
Stellar could rally if it breaks above the symmetrical triangle
Stellar price trades inside a symmetrical triangle, a technical pattern formed by connecting multiple highs and lows with two converging trendlines (from the end of November to mid-January). This technical pattern has a bullish bias, and the target is generally obtained by measuring the distance between the first swing high and the first swing low to the breakout point.
On Monday, the Stellar price was retested, and support was found around the lower trendline of the symmetrical triangle. However, it declined slightly by 3.4% until Wednesday. At the time of writing on Thursday, it recovers slightly and trades around $0.40..
Assuming the breakout happens by closing a daily candlestick above the daily resistance level at $0.49, the technical target obtained by this pattern would be $0.84, which is 111% of its current trading level. Investors should be cautious of this theoretical move as it could face a slowdown after a 58% rally to retest its November 24 high of $0.63 as traders could opt to book profits.
For the bullish outlook to play out, Stellar’s Relative Strength Index (RSI) indicator on the daily chart must maintain levels above its neutral level of 50, and the Moving Average Convergence Divergence (MACD) indicator must also show a bullish crossover on a daily basis.
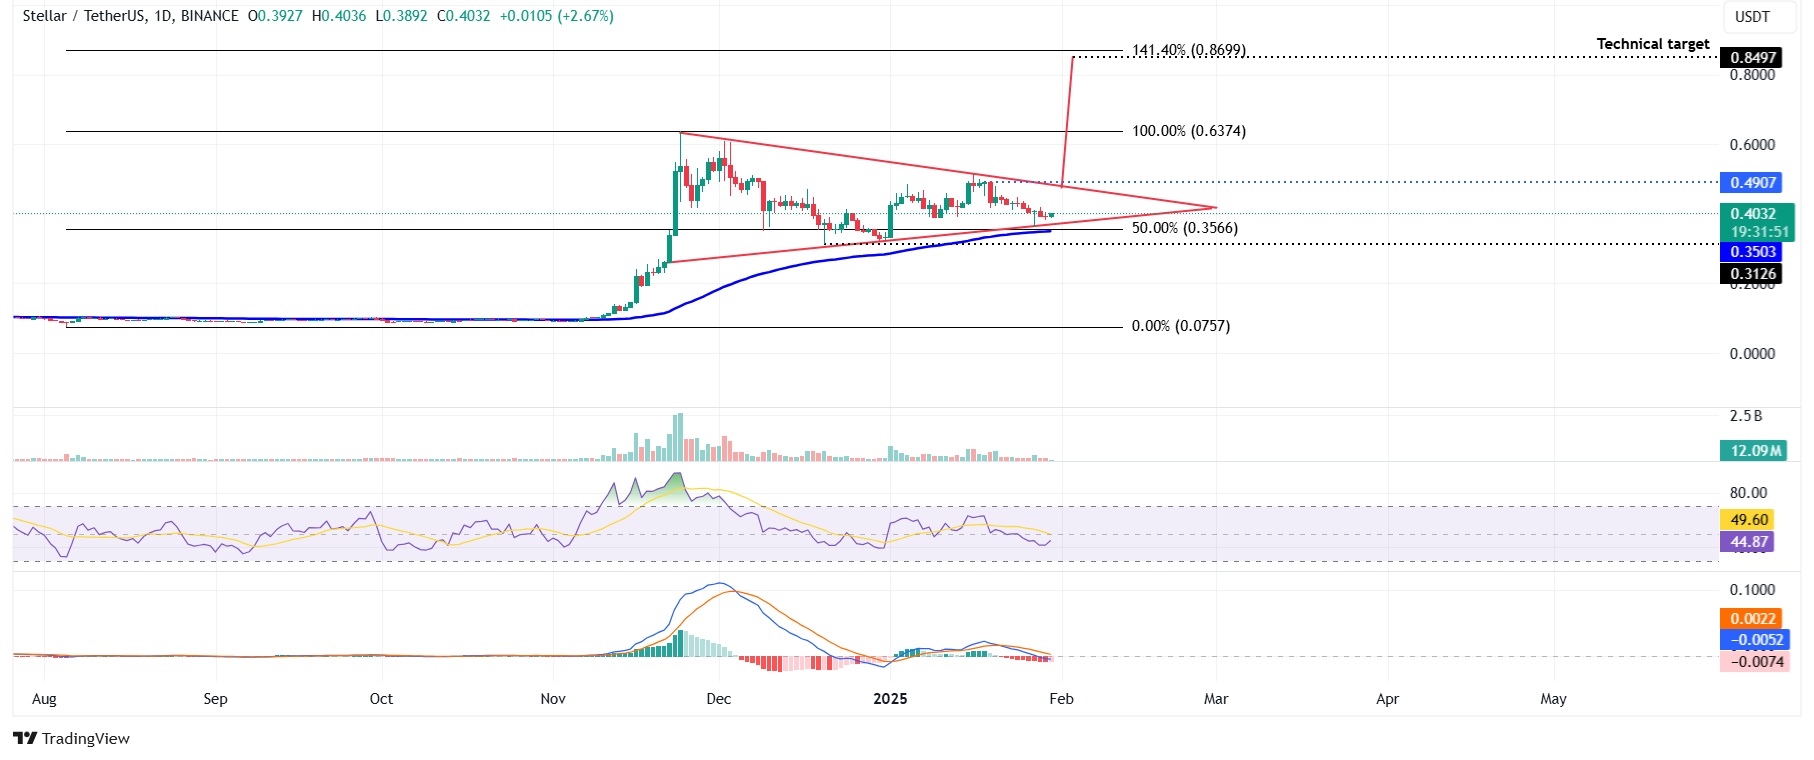
XLM/USDT daily chart
However, the bullish thesis would be invalidated if XLM breaks below its lower trendline of the symmetrical triangle and closes below its 200-day Exponential Moving Average (EMA) at $0.35. This bearish price action would extend the decline to test its December 20 low of $0.31.
Author

Manish Chhetri
FXStreet
Manish Chhetri is a crypto specialist with over four years of experience in the cryptocurrency industry.

