XRP price rebounds alongside Bitcoin as investors buy the dip
- XRP rebounds after immense volatility in recent days, triggered by US President Donald Trump’s reciprocal tariffs.
- A negative MVRV ratio signals that XRP is significantly undervalued, calling on traders to buy the token.
- A noticeable decline in the network’s on-chain activities could slow recovery.

Ripple (XRP) seeks stability in a volatile crypto landscape influenced by macroeconomic factors, including reciprocal tariffs. The international money transfer token hit a low of $1.64 on Monday after opening the week at $1.92, representing a 14.5% daily drop. At the time of writing on Tuesday, during the late Asian session, XRP had recovered Monday losses, exchanging hands at $1.92, as global markets continue to adjust and digest United States (US) President Donald Trump’s ever-changing tariff policy.
XRP rebound targets $2 as President Trump maintains tariff tune
After a gruesome sell-off on Monday, major assets like Bitcoin (BTC), Ethereum (ETH), and Solana (SOL) are bouncing back. Trump’s blanket 10% reciprocal tariffs announced on April 2 will be effective on Wednesday.
Despite the bleeding in global markets, including US stocks, Trump insisted during a press conference with Israeli Prime Minister Benjamin Netanyahu on Monday that tariffs would continue as planned. The president seemed to add fuel to the fire, threatening an additional 50% tariff on China.
It is not immediately clear whether the recovery in XRP price to $1.92 is sustainable, especially with tariffs taking effect in just a day. Meanwhile, some on-chain fundamentals support the beginning of a larger rebound, calling on investors to consider buying XRP at current levels.
Santiment’s Market Value Realized Value (MVRV) metric holds 9.47% below the mean at 1 in the chart, suggesting that XRP is heavily undervalued. Traders holding the XRP token are unlikely to sell at the current price as they would realize substantial losses. This situation could translate to reduced selling pressure, hinting at a potential rebound amid growing seller exhaustion. A negative MVRV ratio has historically been viewed as a buy signal.
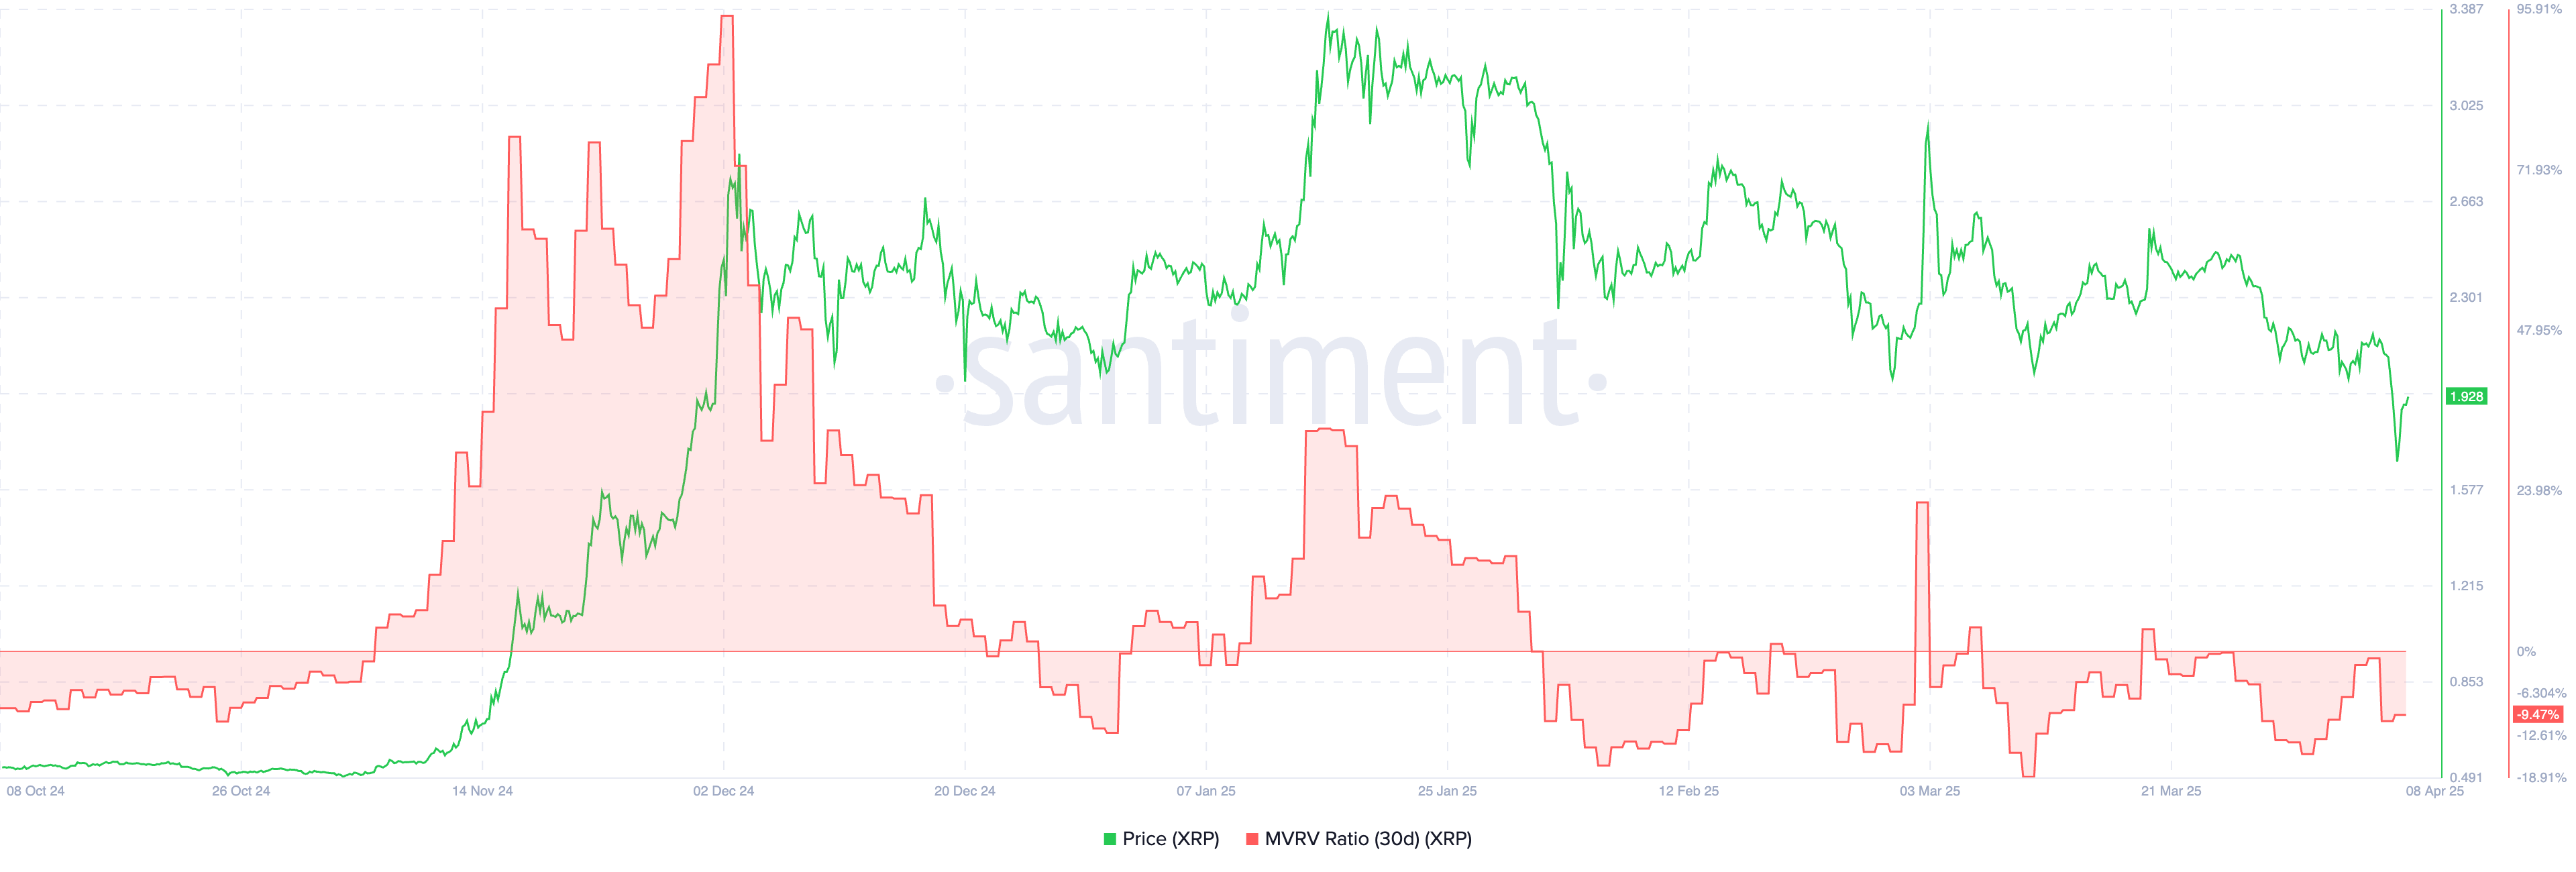
XRP MVRV | Source: Santiment
Can XRP sustain a recovery above $2?
XRP could rejuvenate its bullish structure if support at $2 is reclaimed. However, bulls must first navigate a volatile landscape to keep the price higher, including a daily close above the 200-day Exponential Moving Average (EMA). Moreover, the Relative Strength Index (RSI) continues to slide toward the oversold region, which may encourage sellers to stay put. At the same time, the Moving Average Convergence Divergence (MACD) indicator sustained a sell signal on March 28, suggesting a deeper downtrend is in play.
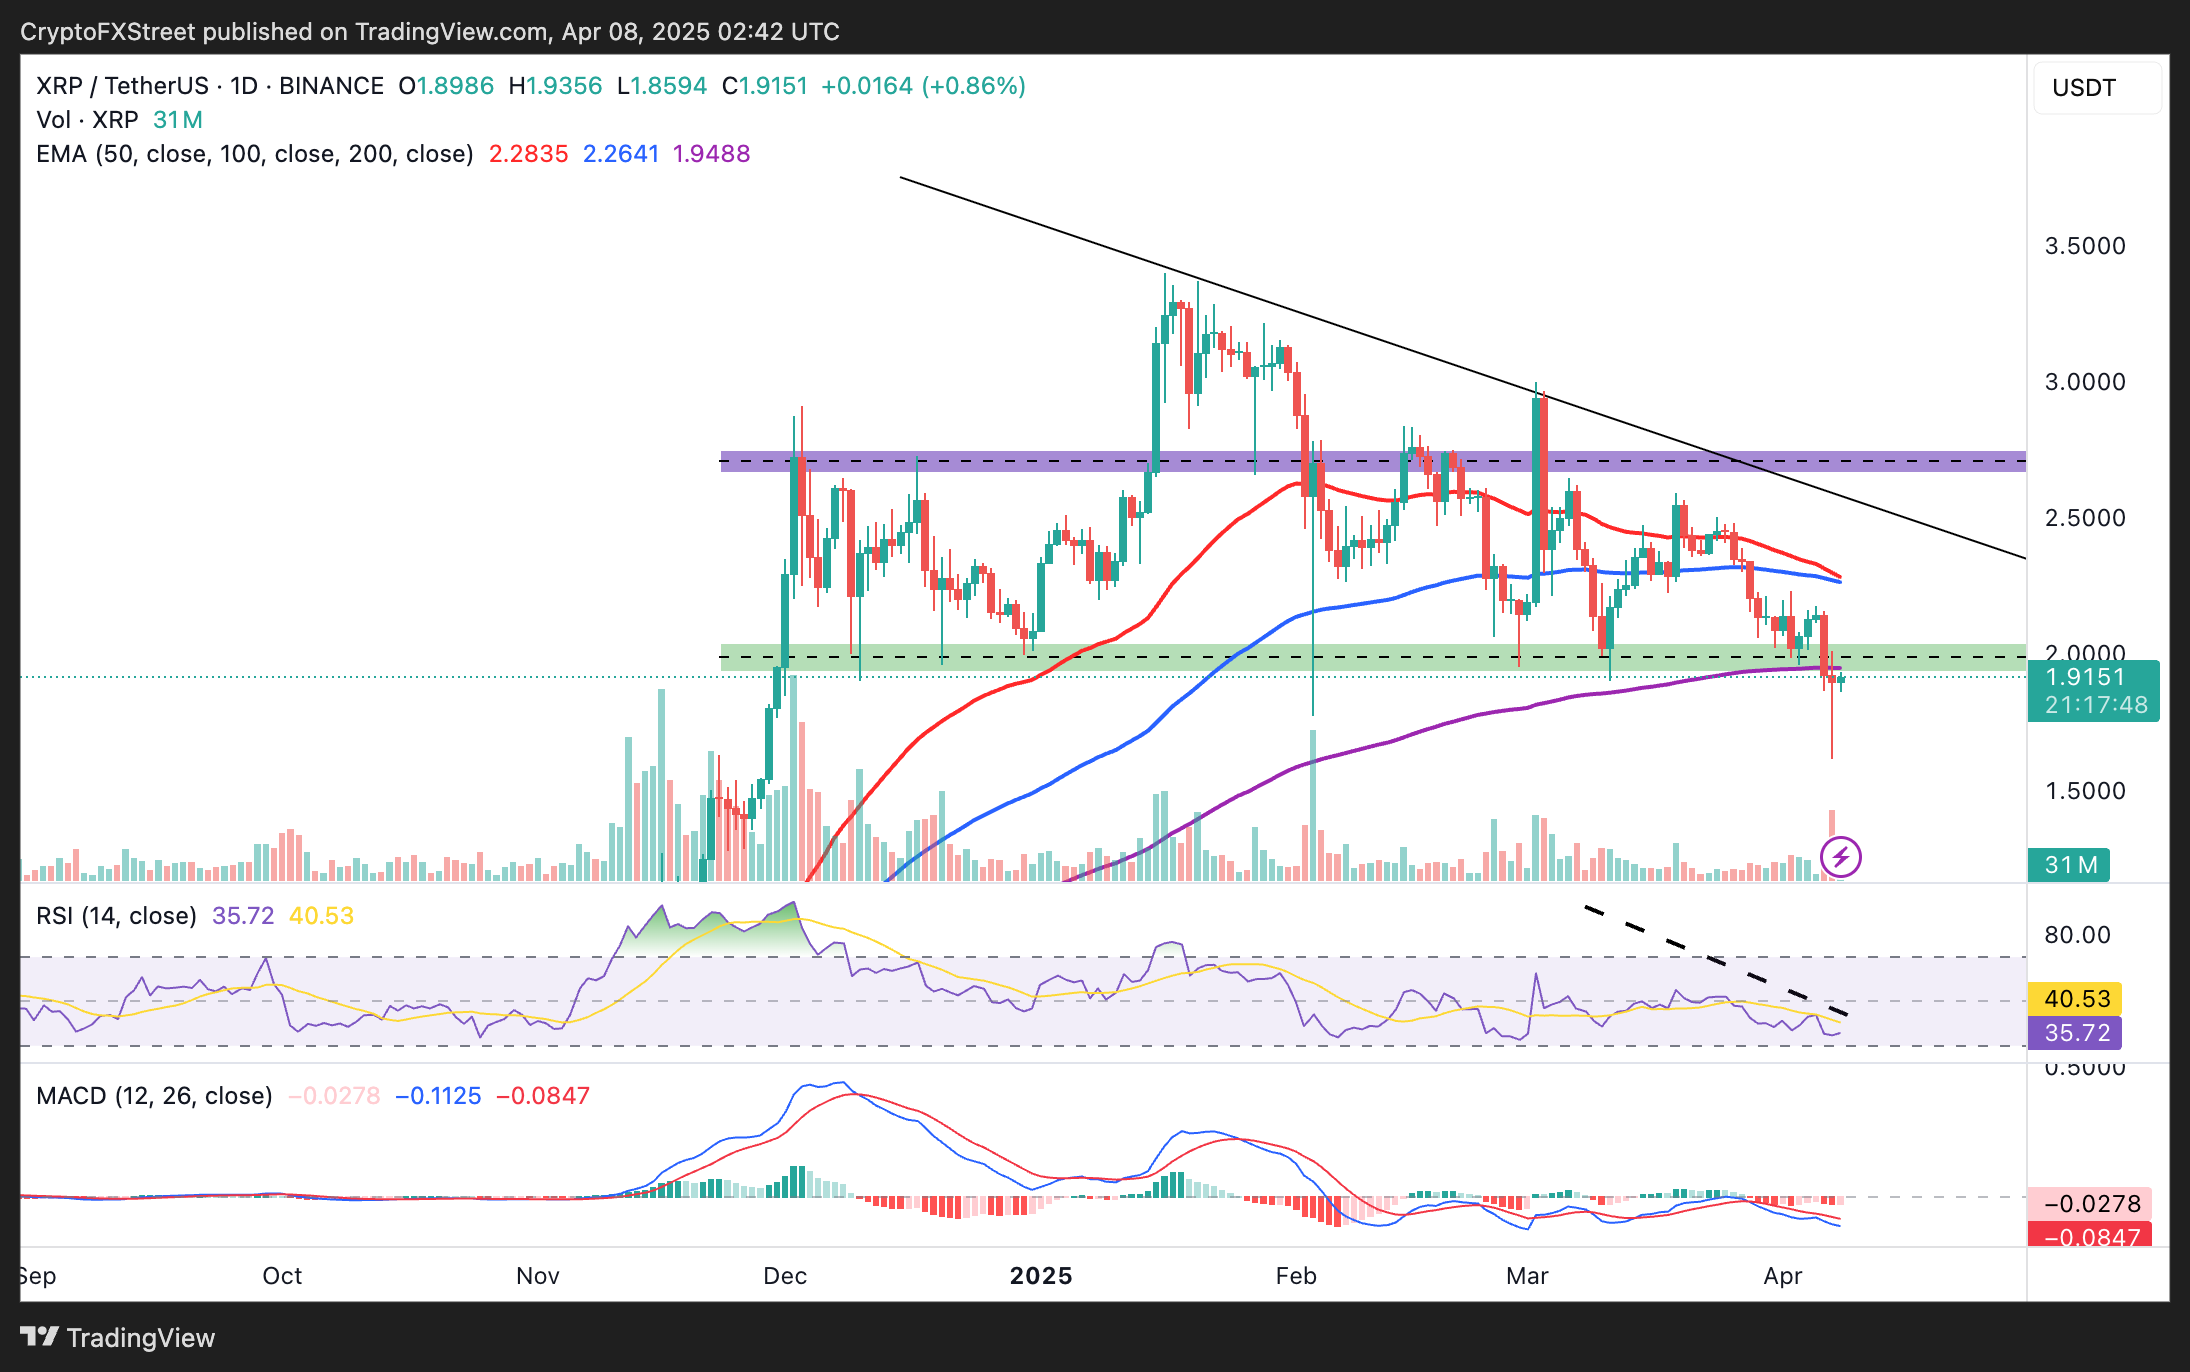
XRP/USDT daily chart
All eyes are set on the bull’s ability to reclaim the $2.00 level as support — a move that could reinforce XRP’s bullish structure and pave the way for recovery to $3.00.
However, the declining network activity observed with Santiment’s Daily Active addresses metric could slow recovery. As per the chart, only 10,100 addresses were active on the network on Monday compared to 581,000 addresses on March 19.
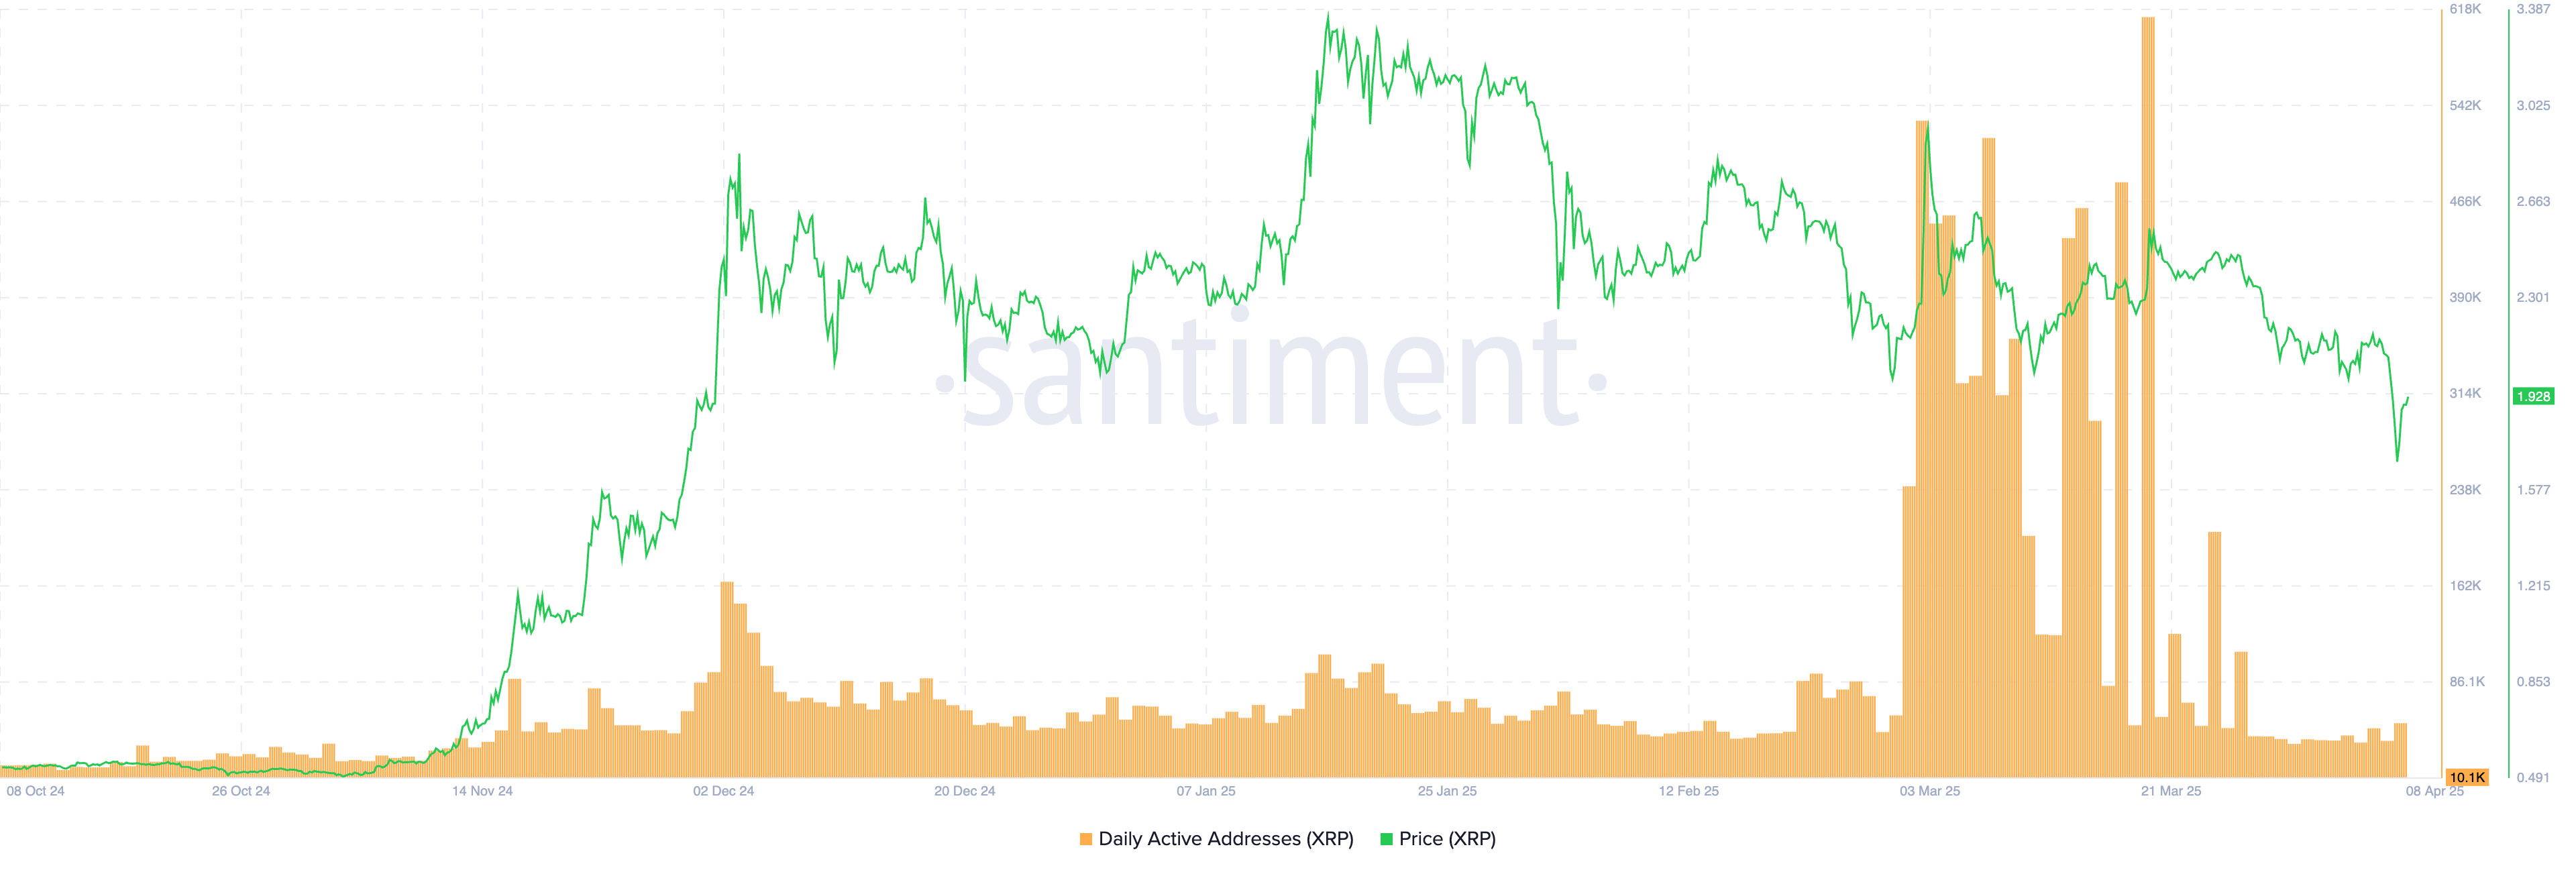
XRP Daily Active Addresses | Source: Santiment
A consistent drop in network activity impacts the underlying asset’s performance, depriving it of momentum to sustain recovery due to low demand. Hence, waiting for a trend confirmation before going all in and buying the dip would be prudent.
Cryptocurrency metrics FAQs
The developer or creator of each cryptocurrency decides on the total number of tokens that can be minted or issued. Only a certain number of these assets can be minted by mining, staking or other mechanisms. This is defined by the algorithm of the underlying blockchain technology. On the other hand, circulating supply can also be decreased via actions such as burning tokens, or mistakenly sending assets to addresses of other incompatible blockchains.
Market capitalization is the result of multiplying the circulating supply of a certain asset by the asset’s current market value.
Trading volume refers to the total number of tokens for a specific asset that has been transacted or exchanged between buyers and sellers within set trading hours, for example, 24 hours. It is used to gauge market sentiment, this metric combines all volumes on centralized exchanges and decentralized exchanges. Increasing trading volume often denotes the demand for a certain asset as more people are buying and selling the cryptocurrency.
Funding rates are a concept designed to encourage traders to take positions and ensure perpetual contract prices match spot markets. It defines a mechanism by exchanges to ensure that future prices and index prices periodic payments regularly converge. When the funding rate is positive, the price of the perpetual contract is higher than the mark price. This means traders who are bullish and have opened long positions pay traders who are in short positions. On the other hand, a negative funding rate means perpetual prices are below the mark price, and hence traders with short positions pay traders who have opened long positions.
Author

John Isige
FXStreet
John Isige is a seasoned cryptocurrency journalist and markets analyst committed to delivering high-quality, actionable insights tailored to traders, investors, and crypto enthusiasts. He enjoys deep dives into emerging Web3 tren



