Top 3 Price Prediction Bitcoin, Ethereum, Ripple: BTC, ETH and XRP recovery could be short-lived
- Bitcoin price hovers around $104,000 on Friday after bouncing off its 50-day EMA earlier this week.
- Ethereum price finds rejection around its descending trendline on Friday, hinting at a downleg ahead.
- Ripple price is sliding toward its ascending trendline support; a close below would lead to a further decline.

Bitcoin (BTC) price hovers around $104,000 on Friday after bouncing off from its 50-day Exponential Moving Average (EMA) of around 98,800 earlier this week. Ethereum (ETH) and Ripple (XRP) approach key resistance levels; if rejected, they could lead to a correction ahead.
Bitcoin price is poised for a downleg if it closes below the 50-day EMA
Bitcoin price found support around its 50-day Exponential Moving Average (EMA) at $98,845 on Monday and rose 2.69% on Thursday, closing above $104,700 on that day. At the time of writing on Friday, it hovers around $104,100.
If BTC breaks below $100,000 and closes below the 50-day EMA on a daily basis, it could extend the decline and test its next key support around $90,000.
The Relative Strength Index (RSI) indicator on the daily chart reads 57, above its neutral level of 50, but points downwards, indicating signs of weakness in bullish momentum. Additionally, the Moving Average Convergence Divergence (MACD) indicator converges, indicating indecisiveness among traders. If the MACD flips to a bearish crossover on a daily basis, it would give a sell signal and suggest a downtrend.
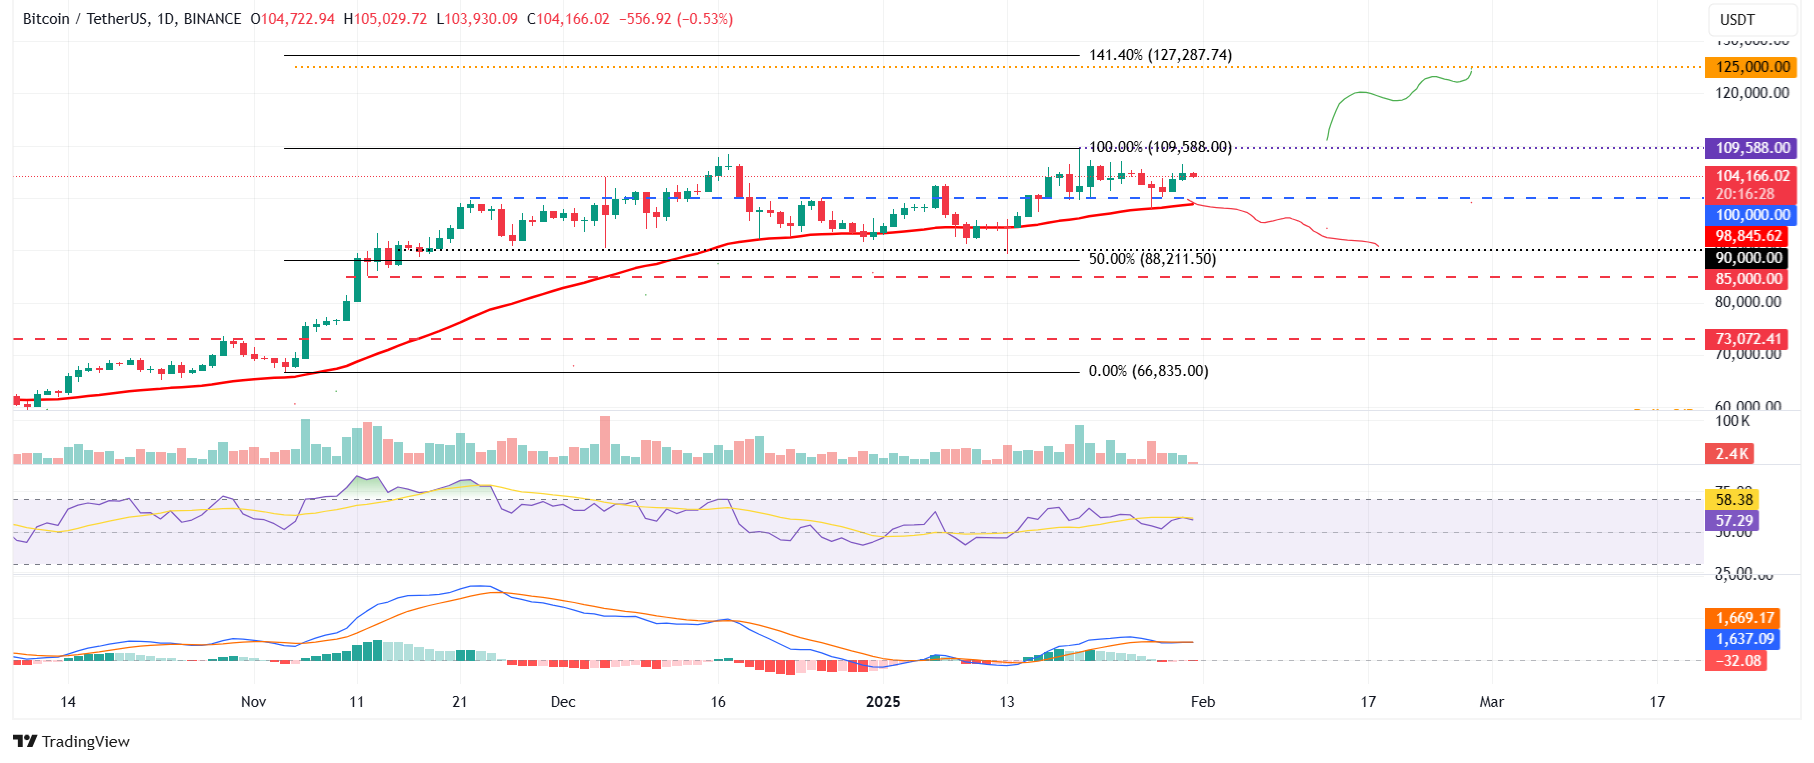
BTC/USDT daily chart
However, if BTC continues recovering, it could retest its January 20 all-time high of $109,588.
Ethereum price faces rejection around its descending trendline
Ethereum price bounced off from its psychological importance level of $3,000 on Monday and rose 6.33% until Thursday. At the time of writing on Friday, it faces rejection near its descending trendline and trades around $3,231.
If the descending trendline holds as resistance, it could extend the decline to retest its psychological importance level of $3,000. A successful close below this level would extend an additional decline to test its next daily support at 2,810.
The RSI on the daily chart reads 46, after rejecting from its neutral level of 50 and points downwards, indicating bearish momentum. Like Bitcoin, the MACD indicators also converge, suggesting indecisiveness among traders.
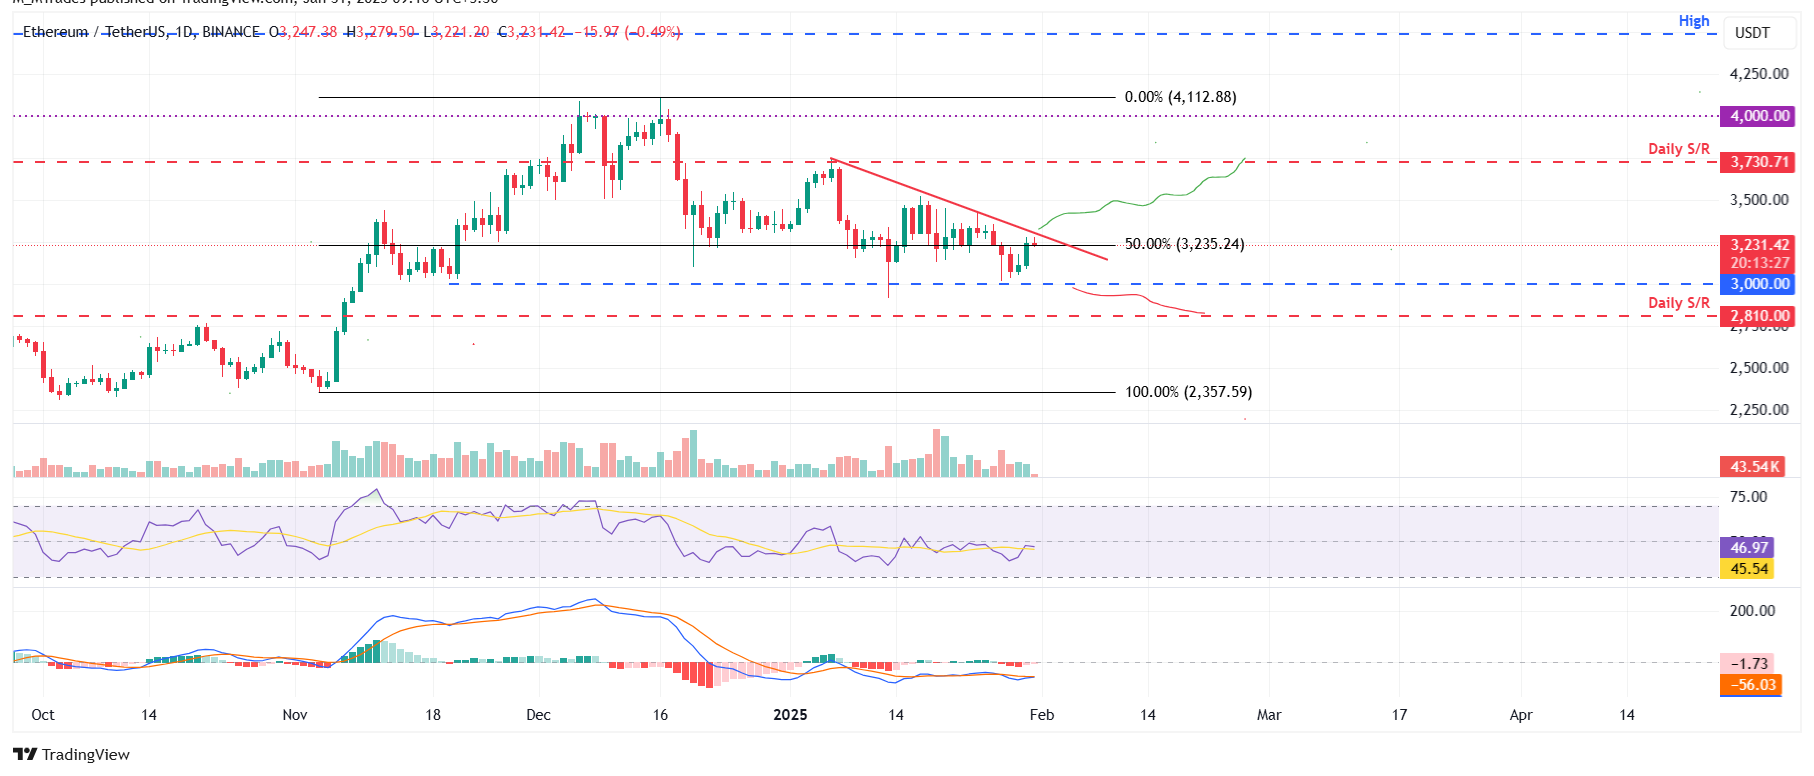
ETH/USDT daily chart
Conversely, if ETH breaks above the descending trendline, it could extend the recovery to test its daily resistance level at $3,730.
Ripple price is primed for a correction if it closes below its ascending trendline
Ripple price bounced off its ascending trendline (drawn by connecting multiple lows since early January) around $2.72 on Monday and rose 2.25% until Thursday. At the time of writing on Friday, it trades slightly down around $3.07.
If Ripple breaks below the ascending trendline and closes below $2.72, it could extend the decline to test its next daily support at $1.96.
The RSI indicator reads 59, above its neutral value of 50 and points downwards after being rejected from its overbought level of 70, indicating weakness in bullish momentum. Additionally, the MACD flipped a bearish crossover on Sunday, giving sell signals and suggesting a downtrend.
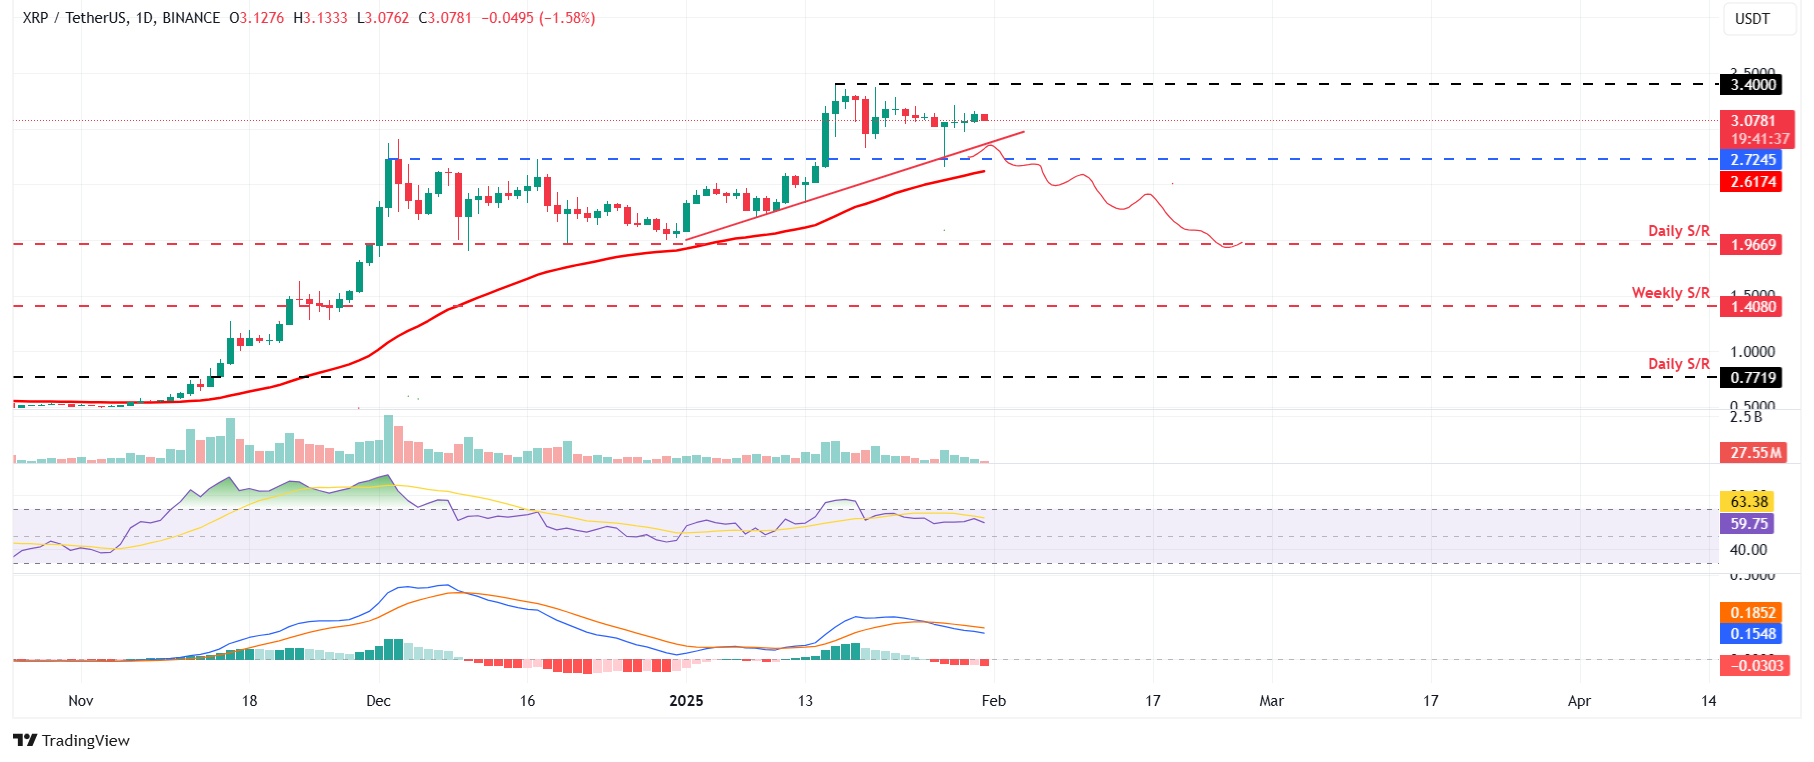
XRP/USDT daily chart
On the other hand, if XRP continues its upward momentum, it could extend the rally to test its $3.40 resistance level.
Bitcoin, altcoins, stablecoins FAQs
Bitcoin is the largest cryptocurrency by market capitalization, a virtual currency designed to serve as money. This form of payment cannot be controlled by any one person, group, or entity, which eliminates the need for third-party participation during financial transactions.
Altcoins are any cryptocurrency apart from Bitcoin, but some also regard Ethereum as a non-altcoin because it is from these two cryptocurrencies that forking happens. If this is true, then Litecoin is the first altcoin, forked from the Bitcoin protocol and, therefore, an “improved” version of it.
Stablecoins are cryptocurrencies designed to have a stable price, with their value backed by a reserve of the asset it represents. To achieve this, the value of any one stablecoin is pegged to a commodity or financial instrument, such as the US Dollar (USD), with its supply regulated by an algorithm or demand. The main goal of stablecoins is to provide an on/off-ramp for investors willing to trade and invest in cryptocurrencies. Stablecoins also allow investors to store value since cryptocurrencies, in general, are subject to volatility.
Bitcoin dominance is the ratio of Bitcoin's market capitalization to the total market capitalization of all cryptocurrencies combined. It provides a clear picture of Bitcoin’s interest among investors. A high BTC dominance typically happens before and during a bull run, in which investors resort to investing in relatively stable and high market capitalization cryptocurrency like Bitcoin. A drop in BTC dominance usually means that investors are moving their capital and/or profits to altcoins in a quest for higher returns, which usually triggers an explosion of altcoin rallies.
Author

Manish Chhetri
FXStreet
Manish Chhetri is a crypto specialist with over four years of experience in the cryptocurrency industry.


