1Inch looks poised for downward correction
- 1inch price faces rejection by the 200-day Exponential Moving Average (EMA) at $0.443.
- On-chain data show that 1INCH development activity is decreasing, signaling negative sentiment among investors.
- A daily candlestick close above $0.464 would invalidate the bearish thesis.
1inch (1INCH) price moves lower by 3% on Friday after being rejected by the 200-day Exponential Moving Average (EMA) on Thursday. On-chain data shows a decline in Development Activity, signaling negative sentiment among 1INCH investors. This development could lead to a downward correction in 1inch’s price.
1inch price set for a downward correction
1inch price retraces by 3% and trades around $0.415 during the European session on Friday after a rejection by the 200-day Exponential Moving Average (EMA) at $0.443 the day before. The 200-day EMA roughly coincides with the daily resistance level at $0.446, making it a crucial resistance level.
If this resistance level holds,1INCH could crash 16% from the current level of $0.415 to the May 13 low of $0.345.
The Relative Strength Index (RSI) and the Awesome Oscillator (AO) indicators support this bearish thesis, as both are below their mean levels of 50 and zero, respectively. This indicates that the bearish momentum is in control, and 1inch price could decline further.
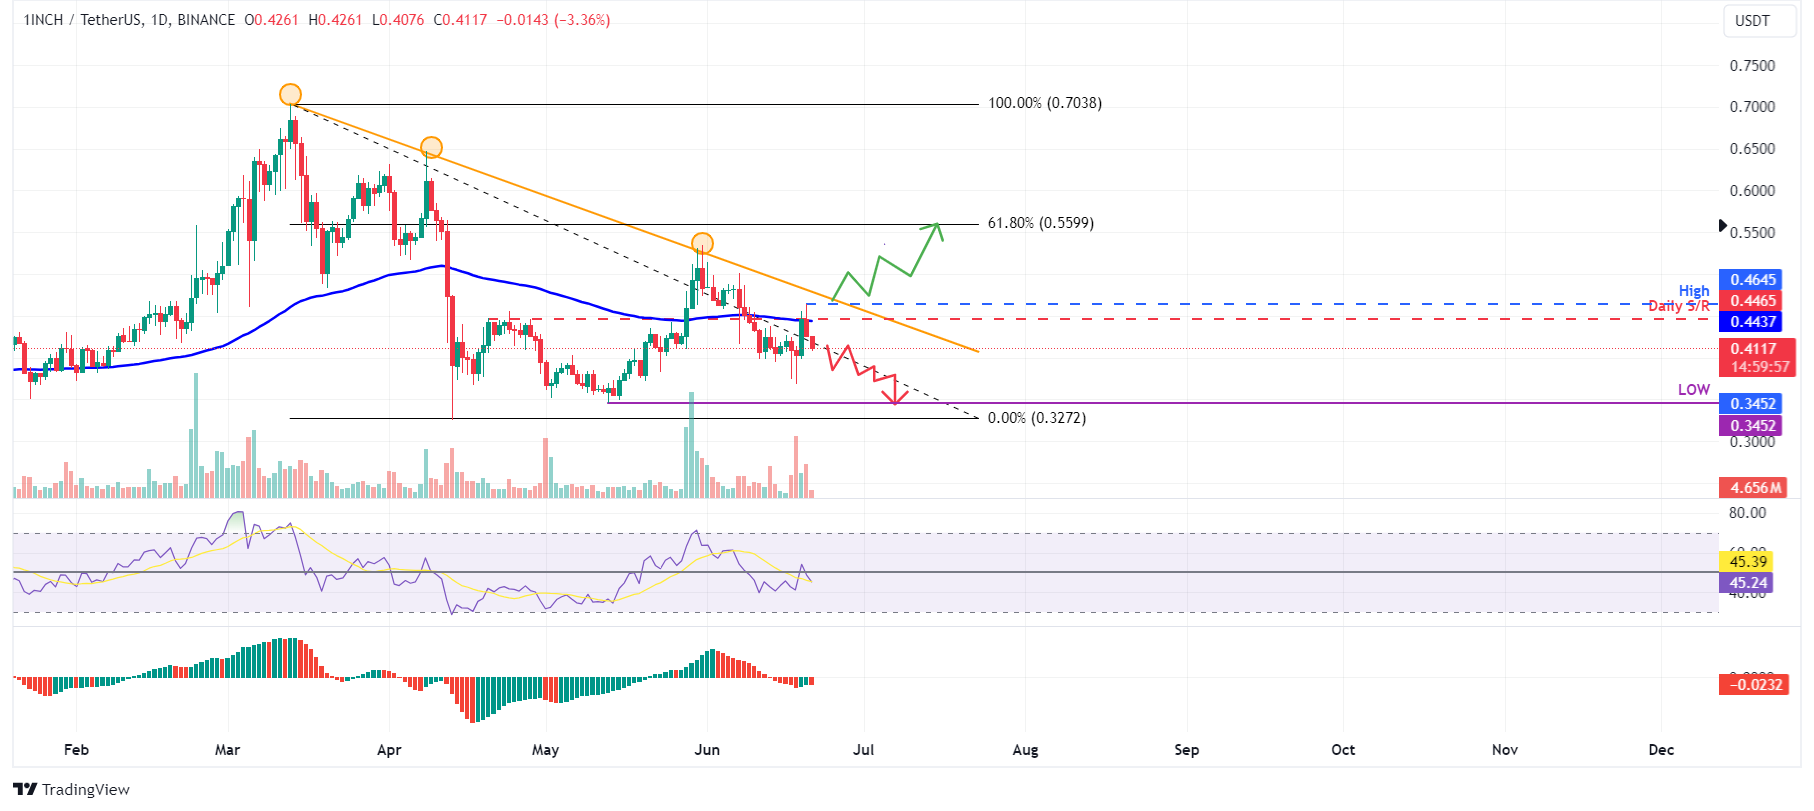
1INCH/USDT 1-day chart
On-chain data also points to a bearish outlook for 1inch. According to IntoTheBlock's In/Out of the Money Map (IOMAP), approximately 2,310 addresses bought 247.49 million 1INCH tokens at an average price of $0.437. If the 1inch price rises to this level, this significant amount of investors may opt to sell to get a breakeven on their positions.
From a technical analysis perspective, the $0.443 resistance level aligns with the IOMAP findings, marking this zone as a crucial reversal point to monitor.
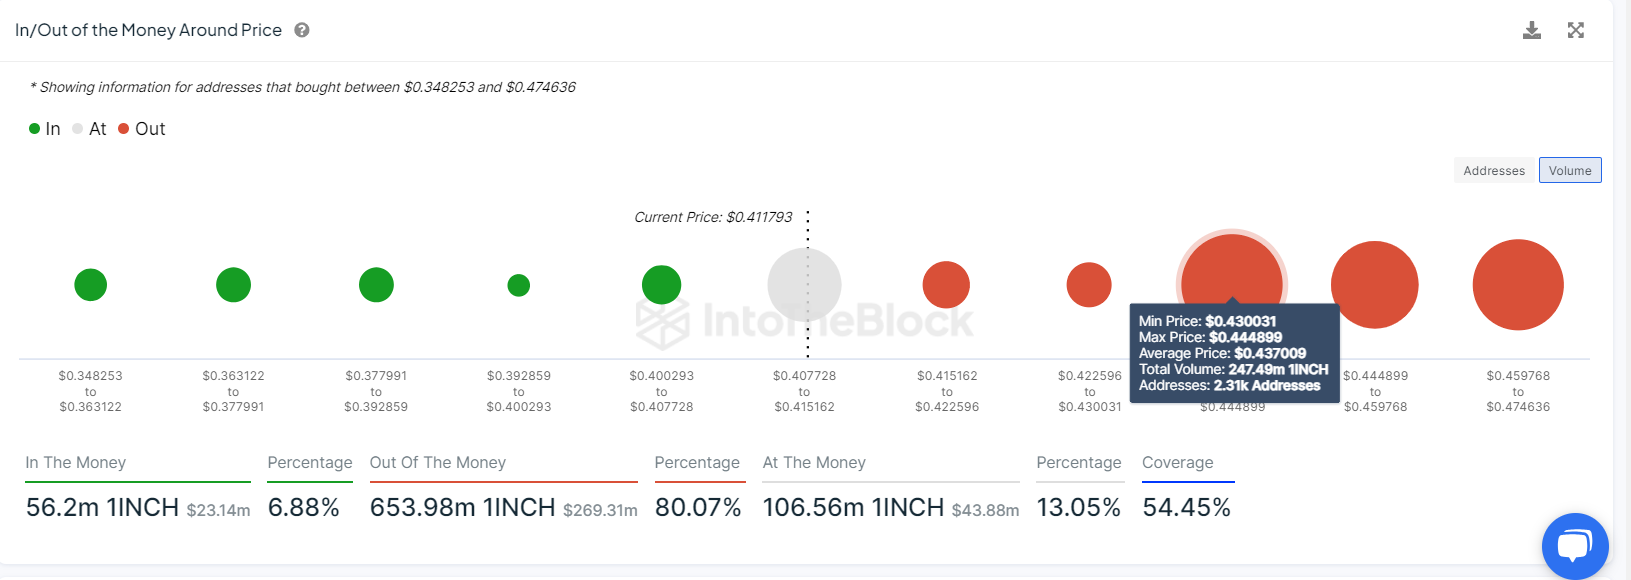
1INCH IOMAP chart
Also, Santiment’s Development Activity metric monitors the frequency of development events documented in the public GitHub repository over a period of time. An increase in this metric typically indicates ongoing efforts to maintain, innovate, and enhance the protocol, which is generally viewed positively by investors and stakeholders. Conversely, a decrease in this metric could lead to concerns regarding the project's sustainability, ability to innovate, and interaction with the community in the coming times.
As in 1INCH’s case, the index declined 8% on Thursday and has constantly decreased since the end of April. The decline in 1inch’s developing activity adds further credence to the bearish outlook.
%20[14.36.48,%2021%20Jun,%202024]-638545647594886567.png)
1INCH Developing Activity chart
Despite the bearish thesis signaled by both on-chain data and technical analysis, if the 1inch daily candlestick breaks above the descending trendline and closes above the June 20 high at $0.464, the outlook will shift to bullish. This scenario could lead to a 20% rally to $0.559, the 61.8% Fibonacci retracement level from the March 13 high of $0.704 to the April 13 low of $0.327.
Author

Manish Chhetri
FXStreet
Manish Chhetri is a crypto specialist with over four years of experience in the cryptocurrency industry.


