Top 3 Price Prediction Bitcoin, Ethereum, Ripple: Bitcoin retraces to crucial support
- Bitcoin price faces rejection at the weekly resistance level of $67,147.
- Ethereum price stabilizes near the $3,362 support level established on June 14.
- Ripple price is encountering a barrier at $0.515, which aligns with its 50-day Exponential Moving Average (EMA).

Bitcoin (BTC) price encounters resistance at weekly highs before retracing to seek support at a crucial level, while Ethereum (ETH) and Ripple (XRP) align closely with Bitcoin's movements, gearing up to surpass resistance barriers and embark on upward rallies.
Bitcoin price encounters major resistance
Bitcoin price was rejected by the weekly resistance level of $67,147 on Monday and is currently trading inside a descending channel. The descending channel is drawn, joining multiple swing high points and swing low point levels between early June and mid-June, as shown in the one-day chart below.
If BTC continues to decline, it could find support at $62,451, the 61.8% Fibonacci retracement level drawn from a swing low of $56,523 on May 1 to a swing high of $71,994 on May 21.
If the $62,451 support holds and BTC breaks above the descending channel, it could rally 7.5% to reach its previous resistance level of $67,147.
The Relative Strength Index (RSI) and the Awesome Oscillator (AO) on the daily chart are below their respective mean levels of 50 and zero. If bulls are indeed making a comeback, then both momentum indicators must maintain their positions above their respective mean levels.
This development would provide additional momentum to the ongoing recovery rally.
If bullish sentiment prevails and the overall cryptocurrency market shows optimism, BTC may extend its rally by 6% from $67,147 to retest its previous resistance level of $71,280.
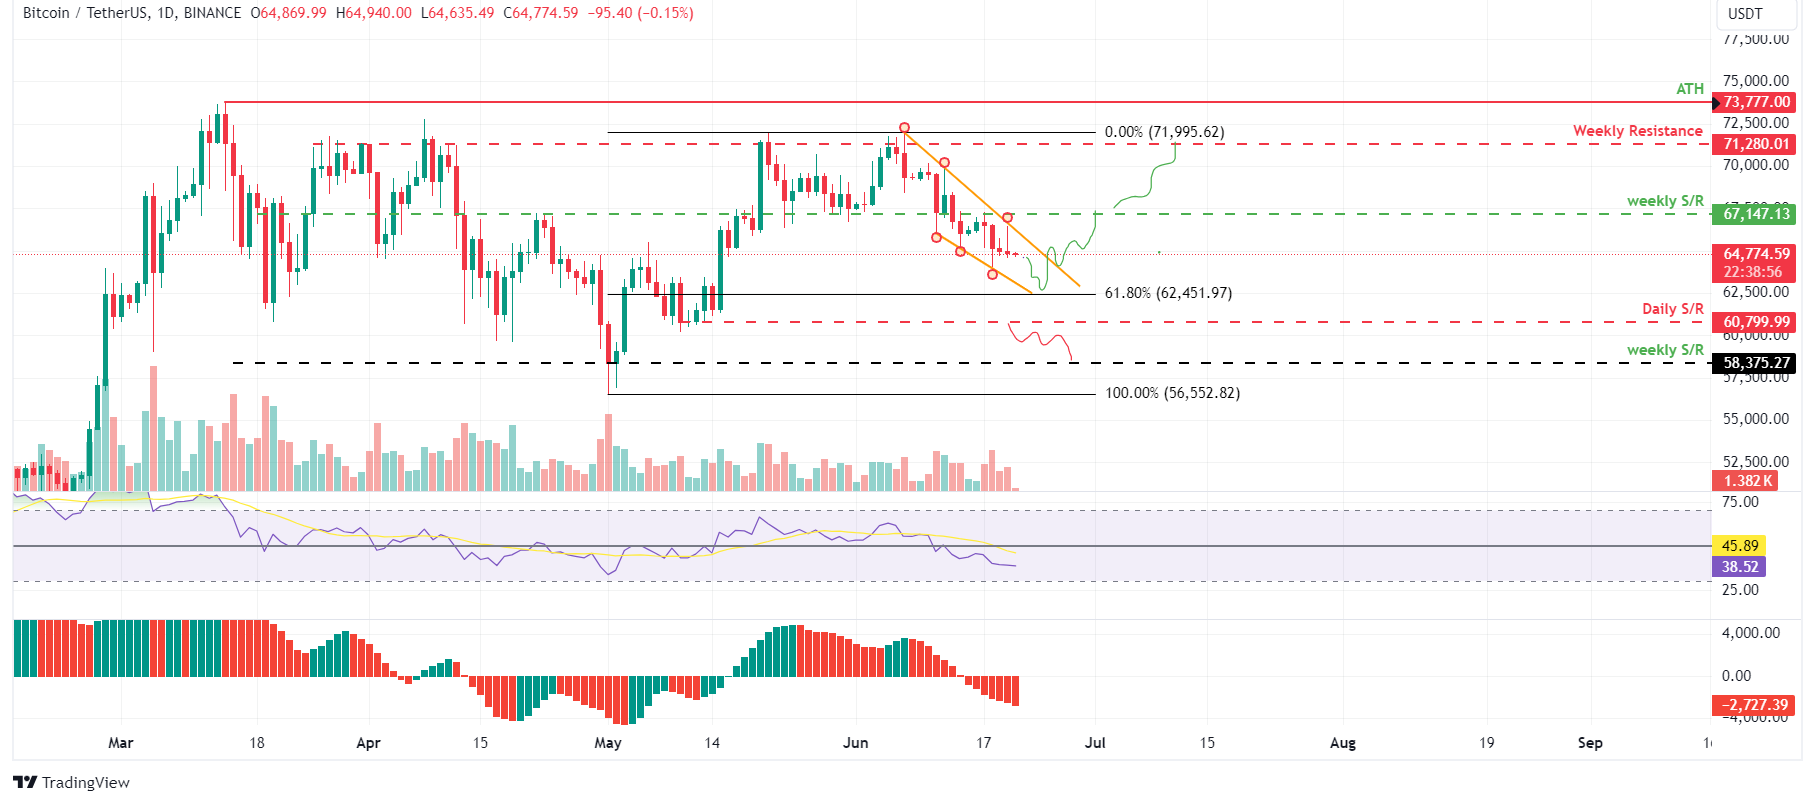
BTC/USDT 1-day chart
However, if Bitcoin price breaks and closes below its daily support level of $60,800, the bullish thesis could be invalidated, leading to a 4% crash, its weekly support level of $58,375.
Ethereum price outlook is optimistic
Ethereum price finds support around the June 14 low at $3,360. On Wednesday, the US Securities and Exchange Commission (SEC) granted it a free pass, currently trading at $3,523—the $3,360 low roughly hovers around the 61.8% Fibonacci retracement level at $3,279.
If this support holds, ETH price could rally 5% from its current trading price of $3,523 to tag its previous high of $3,717 on June 9.
The Relative Strength Index (RSI) in the daily chart struggles to close above its mean level of 50, while the Awesome Oscillator (AO) trades below its mean zero. If bulls are indeed making a comeback, then both momentum indicators must maintain their positions above their respective mean levels.
If ETH closes above $3,717, it could extend an additional rally of 7% to reach its previous resistance level of $3,977.
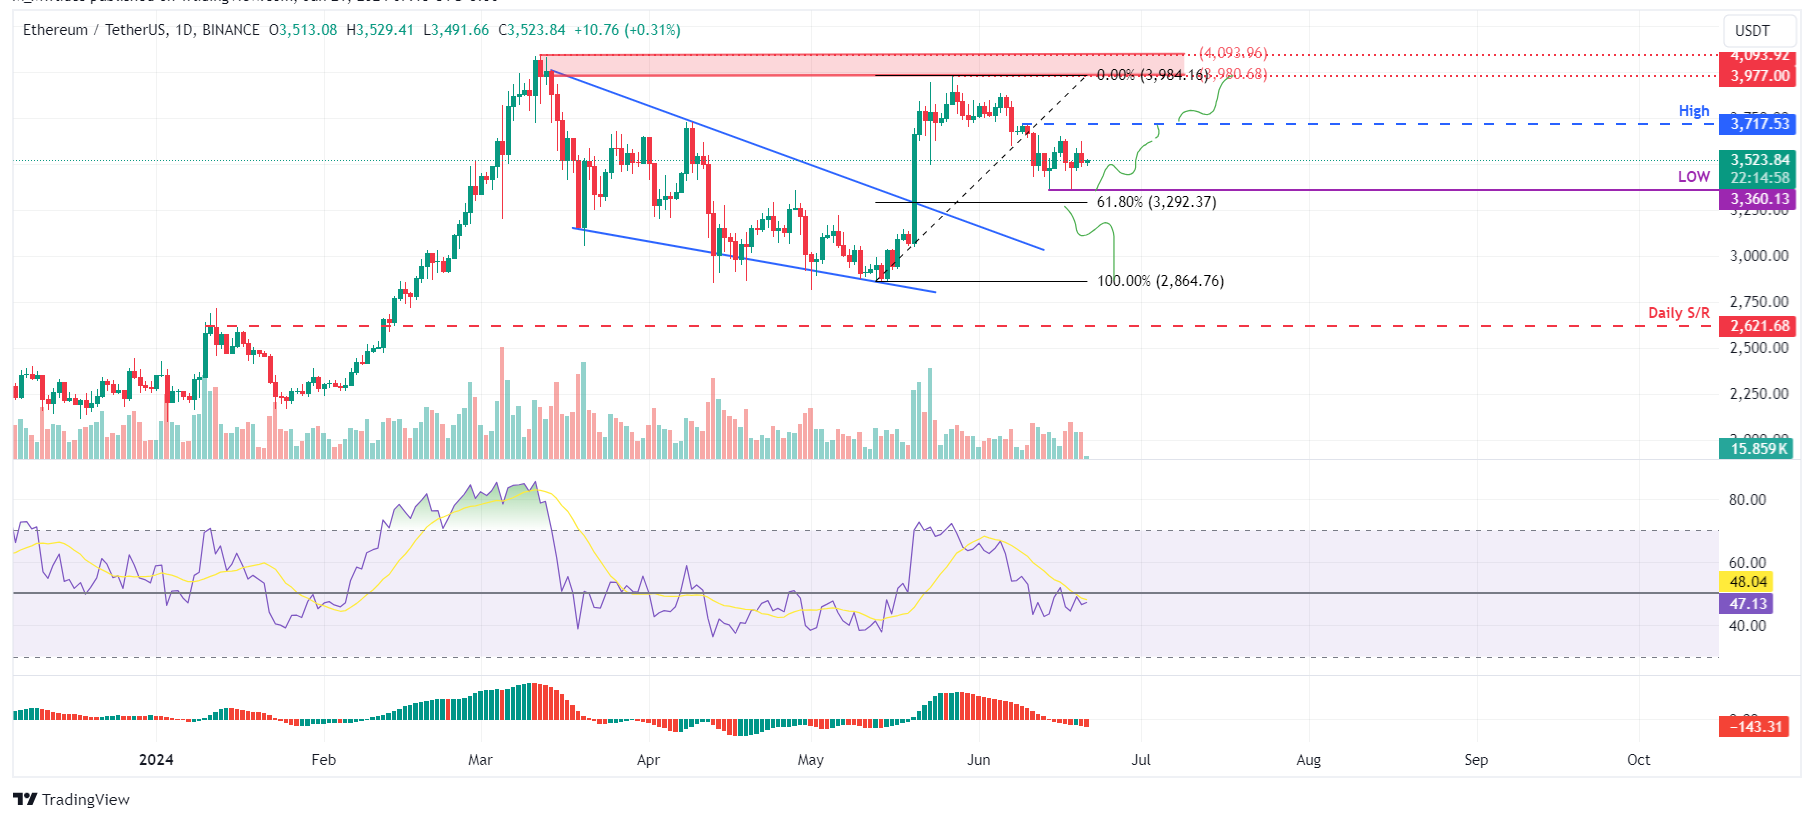
ETH/USDT 1-day chart
On the other hand, if Ethereum's daily candlestick price closes below the $3,292 level, it would produce a lower low and signal a break in the market structure. This move would invalidate the aforementioned bullish thesis, potentially triggering an extra 13% crash to the previous support level of $2,864.
Ripple price shows promise
Ripple price faced resistance at $0.515, its 50-day Exponential Moving Average (EMA) on Monday, and is currently trading at $0.490.
If the ripple price breaks above the 50-day EMA at $0.512, it could rise 7% from $0.499 to $0.532, its previous high of June 5.
The Relative Strength Index (RSI) in the daily chart is below the 50 mean level, while the Awesome Oscillator (AO) is below its zero line. If bullish momentum persists, both momentum indicators must remain above their respective thresholds of 50 and zero. This would provide further support to the recovery rally.
If the XRP daily candlestick closes above $0.532, it could extend an additional 9% rally to $0.581, a 50% price retracement level of $0.419 and $0.744 from March 11 to April 13.
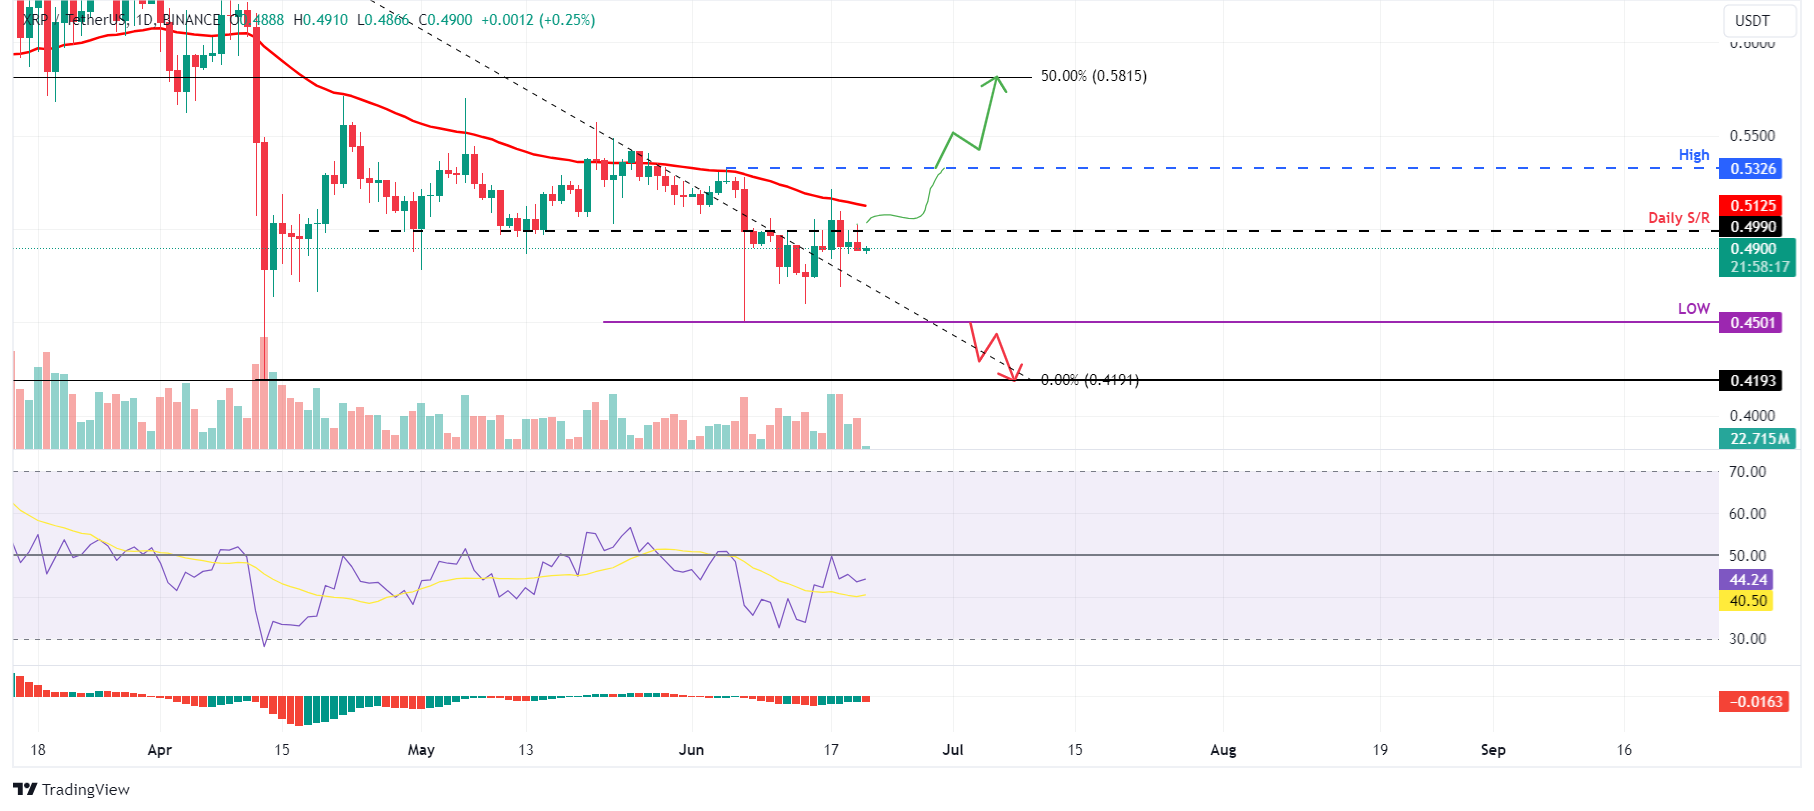
XRP/USDT 1-day chart
Conversely, if Ripple's daily candlestick closes below $0.450, marking the June 7 low, establishing a lower low on the daily chart would invalidate the bullish outlook. This scenario might lead to a 7% decline in XRP's price towards the April 13 low of $0.419.
Author

Manish Chhetri
FXStreet
Manish Chhetri is a crypto specialist with over four years of experience in the cryptocurrency industry.


