1INCH price likely to provide buying opportunity before a 20% rally
- 1INCH price eyes a retest of the $0.443 to $0.471 support zone.
- Increasing Open Interest and a plummet in supply on exchanges indicate investors' are accumulating.
- 1INCH could rally 20% to $0.560.
- A daily candlestick close below $0.327 would invalidate the bullish thesis.
1INCH (1INCH) price falls on Friday, and it is likely to face a further pullback after rallying 15% since Tuesday. However, a price decline towards $0.471-$0.443 could provide an opportunity for sidelined buyers as on-chain metrics and open interest data suggest that this area is a major support zone from which prices could rally by 20%.
1INCH price rally is fueled by rising Open Interest
Data from CoinGlass shows the Future's Open interest of 1INCH at exchanges is increasing. The Open Interest indicates the total number of outstanding derivative contracts that have not been settled (offset by delivery) and whether money flows into the contract are increasing or decreasing.
Increasing Open Interest represents new or additional money coming into the market and new buying happening, which is a bullish trend. When Open Interest decreases, it is usually a sign that the market is liquidating, more investors are leaving, and the current price trend is ending.
As shown in the graph, the Open Interest of 1INCH increased from $17.54 million on May 24 to 32.53 million on May 30, indicating that new or additional money is coming into the market and new buying is happening. A similar trend was seen in the bullish price movement from February 26 to March 16.
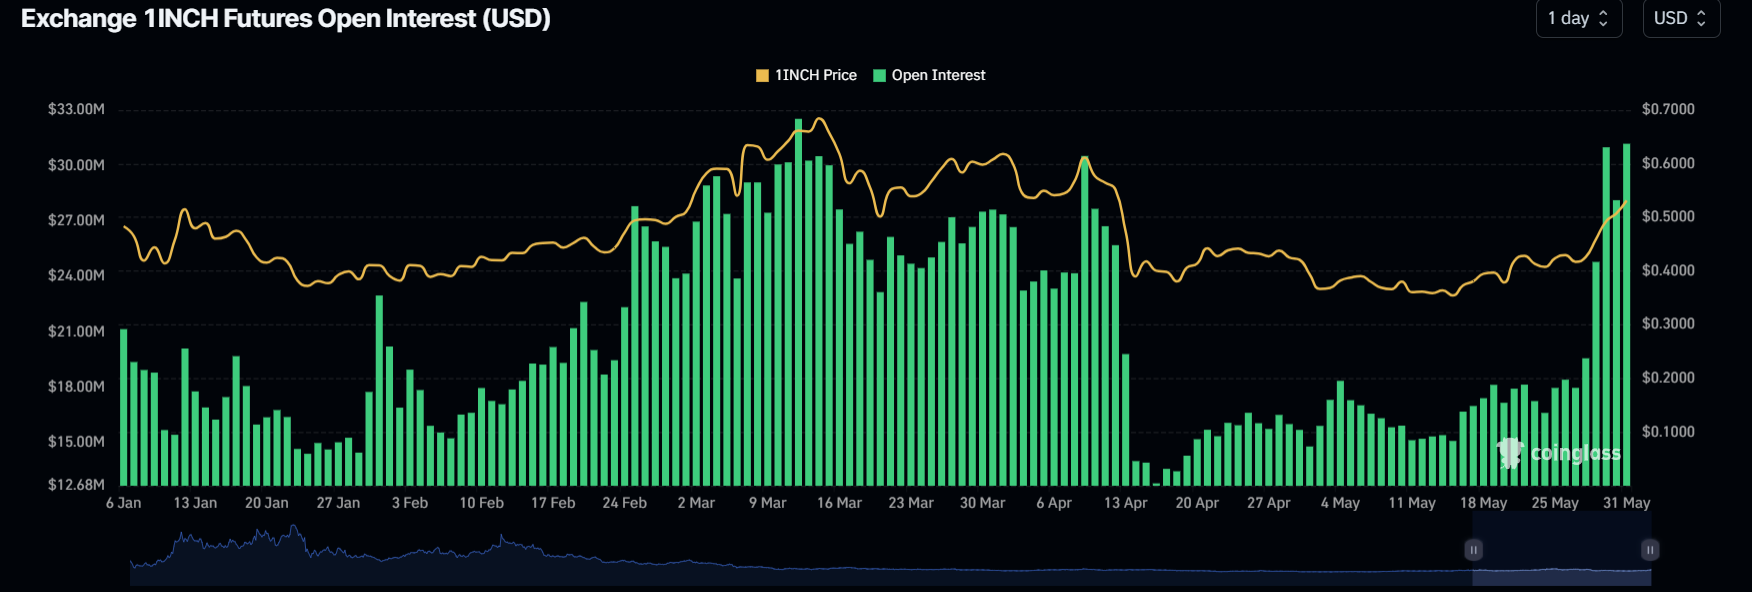
1INCH 1-day Open Interest chart
1INCH price shows promise for a potential rally
1INCH price broke the resistance level at $0.443 on Tuesday and has rallied 17% since then.Due to this sharp move to the upside, 1INCH bulls could take a break, leading to a retracement.
Investors looking for buying opportunities can do so at the support zone between $0.471 and $0.443, which coincides with the 200-day Exponential Moving Average (EMA) at $0.439.
Assuming 1INCH price bounces off the $0.471 level, it could rally 20% to the 61.8% Fibonacci retracement level (plotted from the March 13 high of 0.704 to the April 13 low of 0.327) at $0.560.
The Relative Strength Index (RSI) and Awesome Oscillator (AO) indicators support the aforementioned bounce, which are firmly present above their respective mean values of 50 and 0. The momentum indicators signal that bulls are in control.
If the bullish outlook persists above $0.560,1INCH could extend the rally by 25% to retest the 100% Fibonacci retracement level at $0.704.
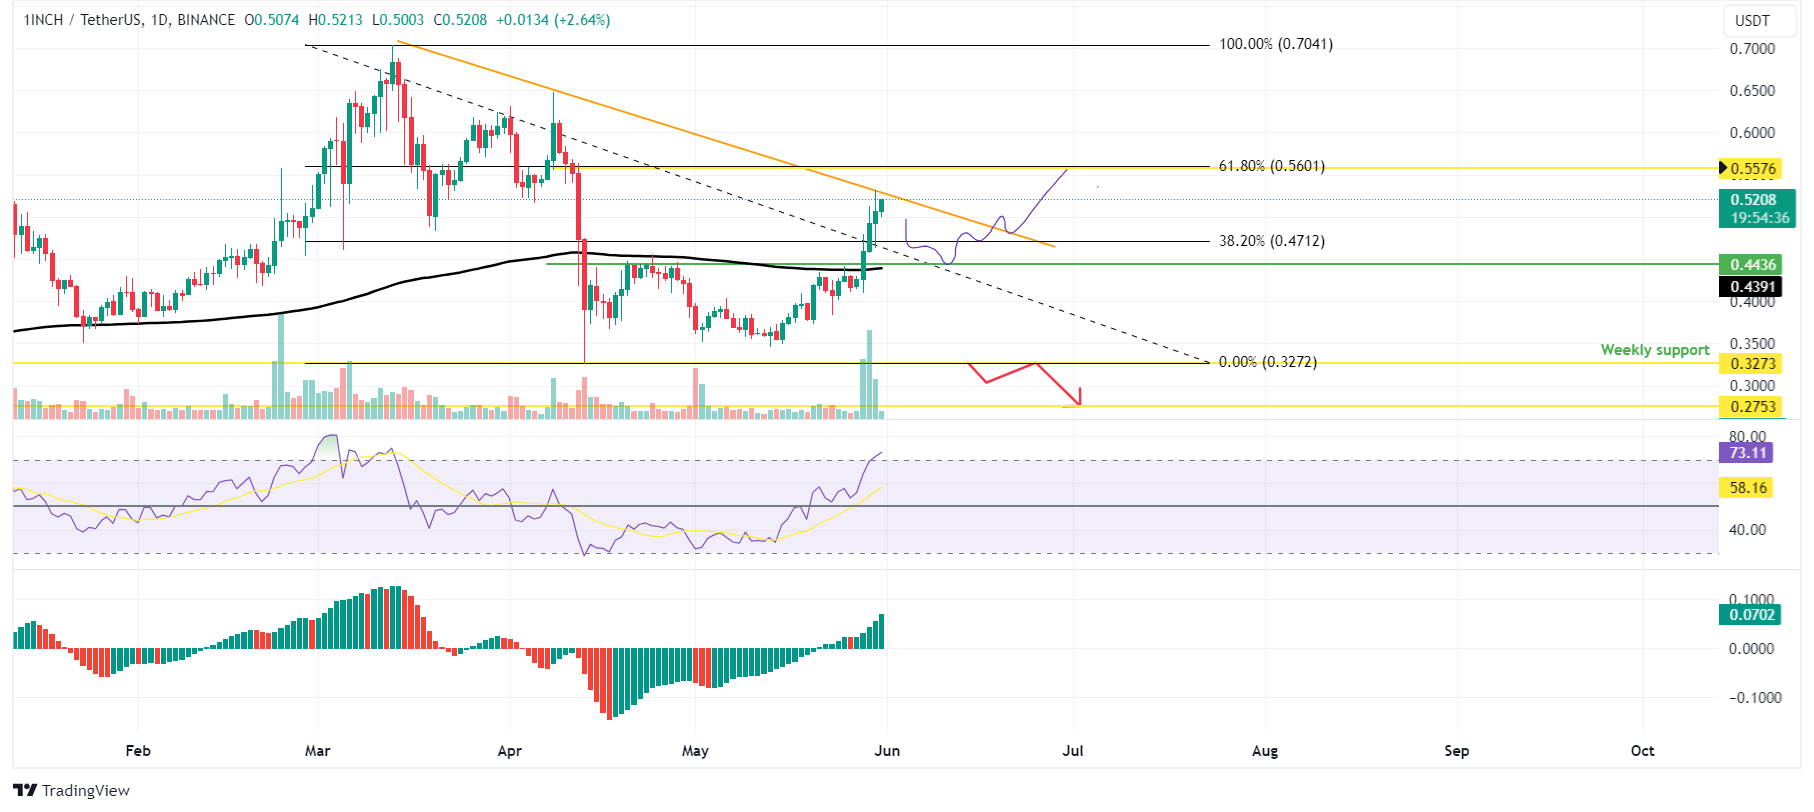
1INCH/USDT 1-day chart
Santiment’s Supply on Exchanges index shows 1INCH tokens available on centralized platforms plummeted from roughly $117 million to $94 million from May 28 to 30. This 19% drop in tokens held on exchanges indicates that the investors are confident in 1INCH price performance and are not looking to sell.
%20[09.41.33,%2031%20May,%202024]-638527394277953618.png)
1INCH Supply of Exchanges chart
Despite strong technical analysis and on-chain data, if the daily candlestick closes below the weekly support at $0.327, then 1INCH price will form a lower low in the higher time frame, indicating a bearish market structure. Thus, the bullish thesis would be invalidated, triggering a potential crash to $0.275, roughly 16% away from $0.327.
Author

Manish Chhetri
FXStreet
Manish Chhetri is a crypto specialist with over four years of experience in the cryptocurrency industry.


