Weekly waves: EUR/USD, Bitcoin and Dow Jones Index
-
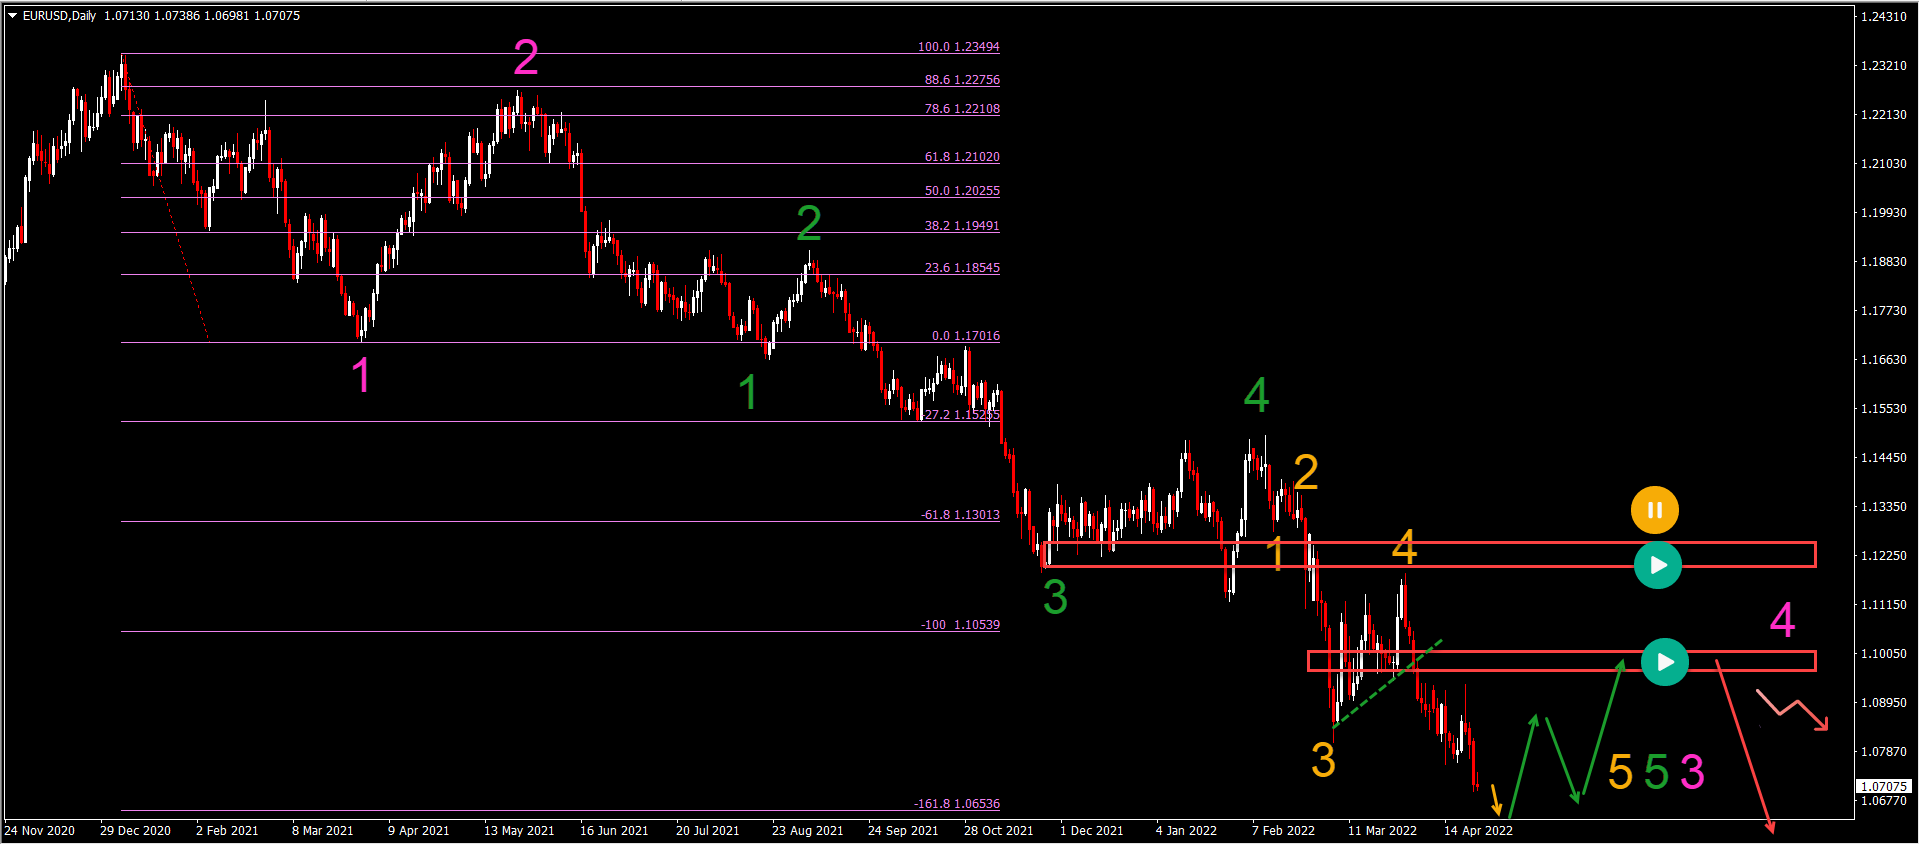
The EUR/USD is now in a wave 3 (pink) rather than a wave C because price action is approaching the -161.8% Fibonacci target.
-
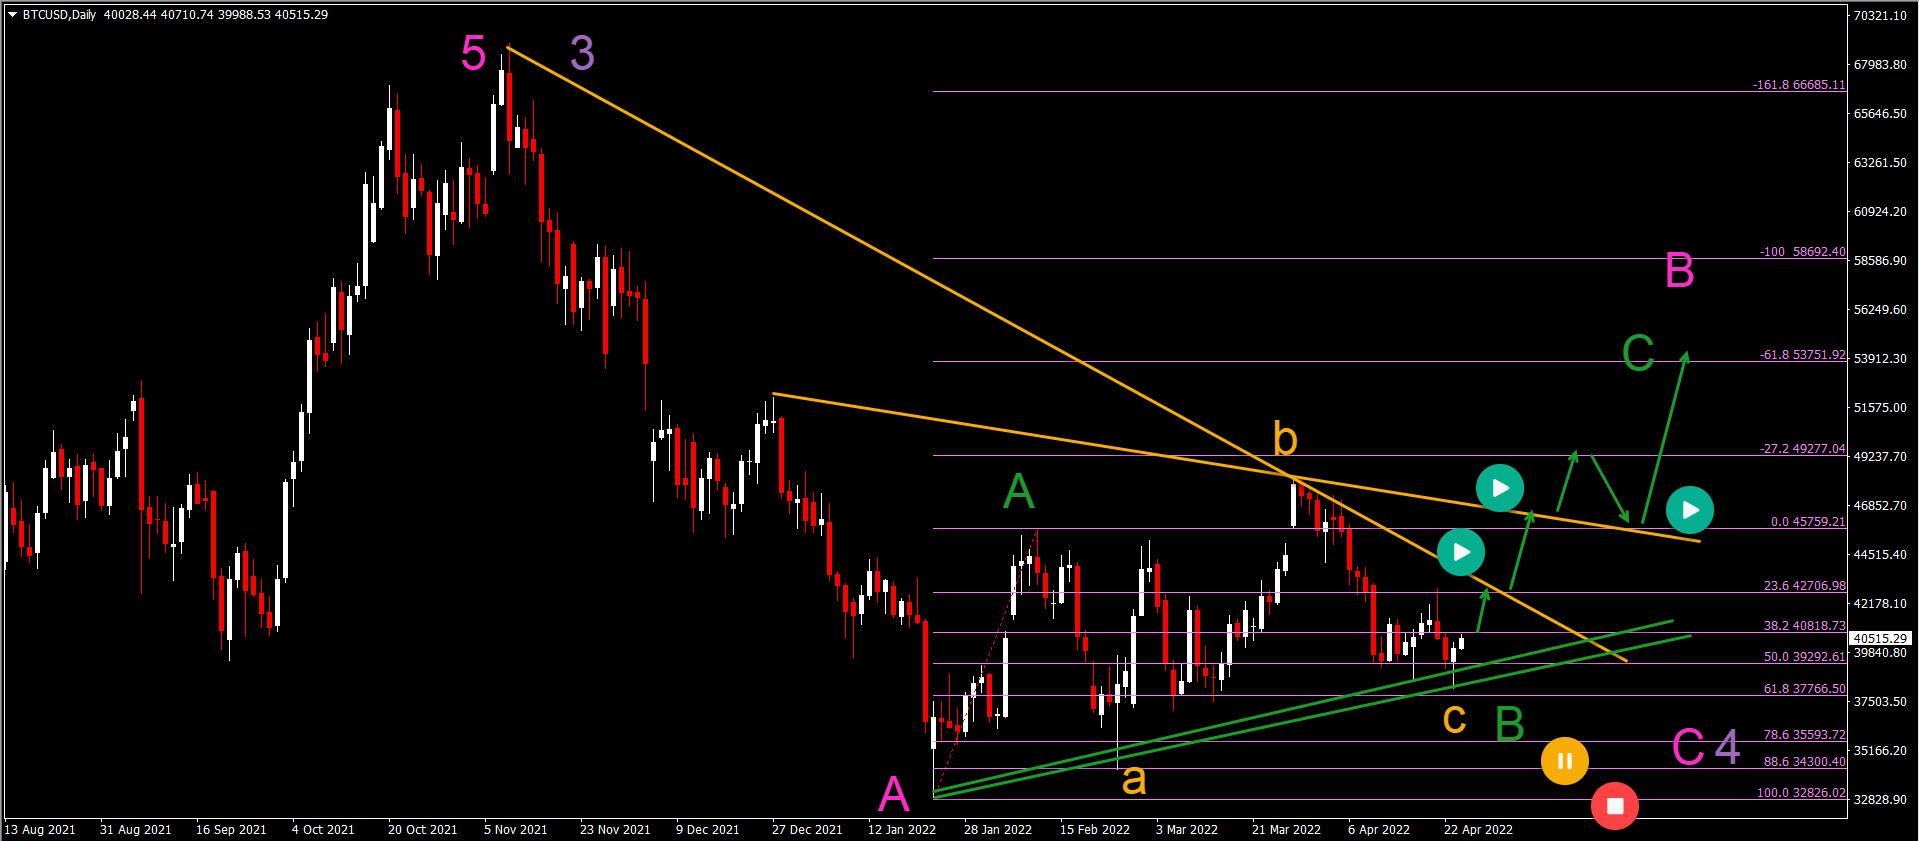
The BTC/USD bullish pinbar is the second one in recent history and offers a double bottom pattern at the support trend lines (green).
-
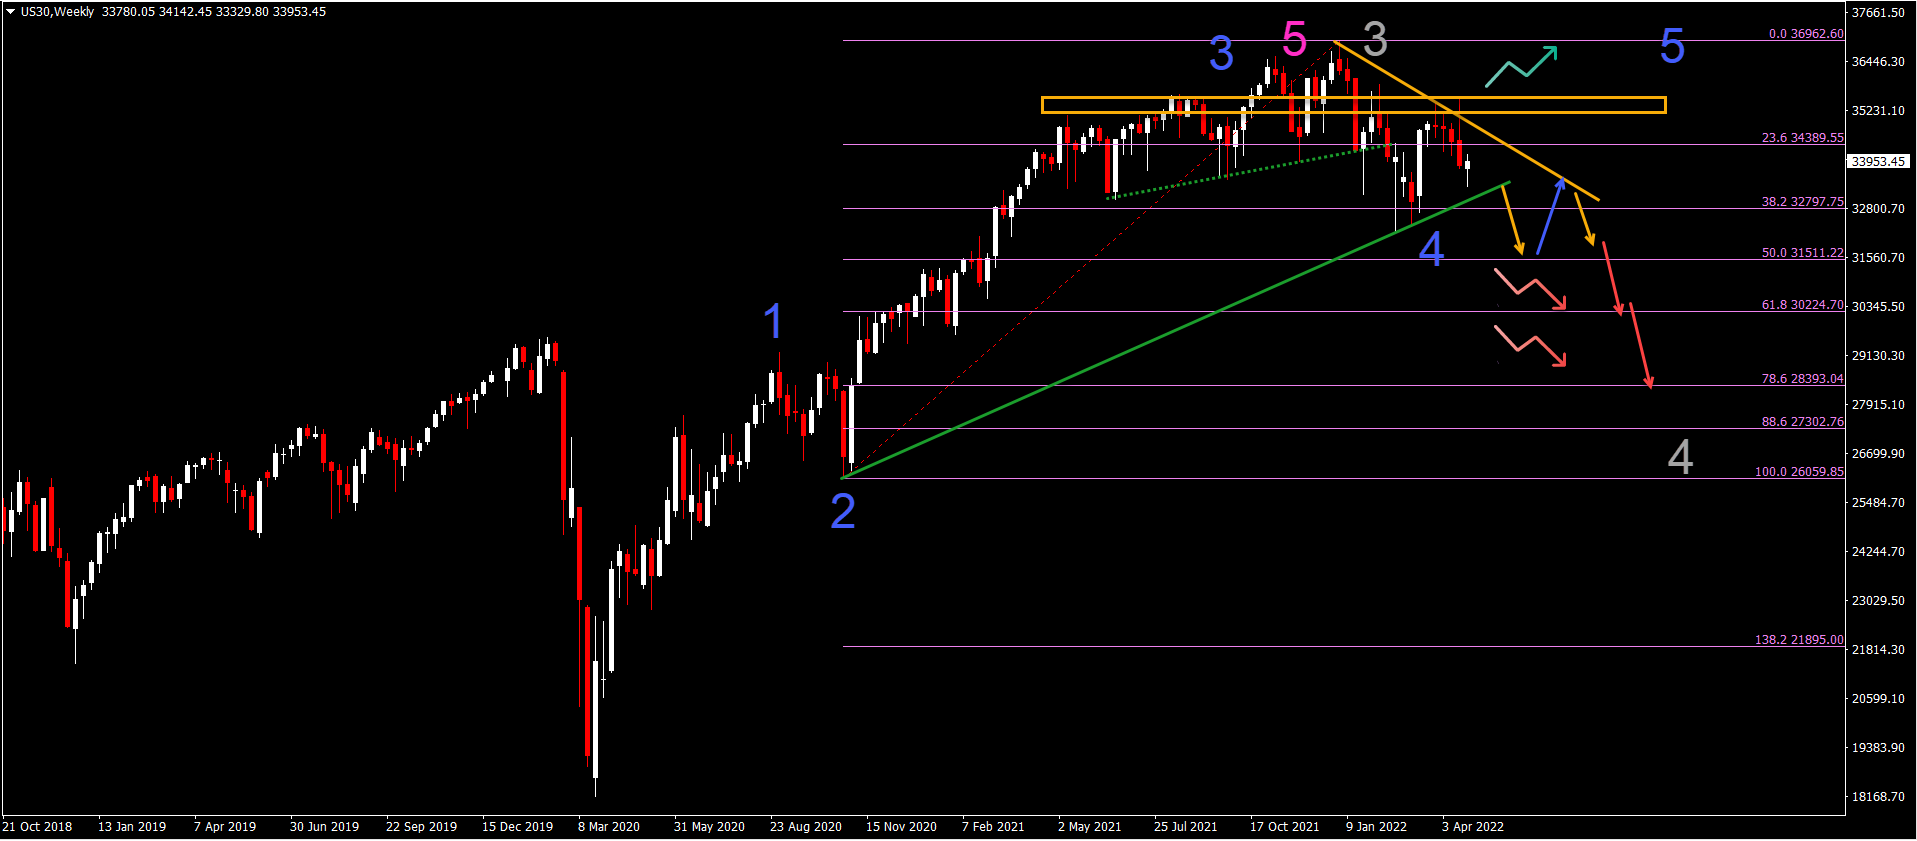
The US30 weekly chart was unable to break above the resistance zone (orange). In fact, price action showed a strong bearish rejection (bearish weekly candle).

EUR/USD confirms bearish wave 3 pattern
The EUR/USD made a key bearish breakout below the support trend line (dotted green). Let’s review what the breakout indicates:
-
The EUR/USD is now in a wave 3 (pink) rather than a wave C because price action is approaching the -161.8% Fibonacci target.
-
The -161.8% Fibonacci target could be a bouncing spot. The strength of the bounce will depend if the wave 3 (pink) will complete at this target or the -200% Fib target.
-
A strong bullish bounce could indicate the end of wave 3 (pink) and the start of wave 4 (pink).
-
A mild bullish reaction indicates that the wave 3 (pink) is still developing and a bearish breakout should see price towards 1.05, 1.04, 1.025, and 1.00.
-
A bullish retracement should usually be shallow which is usual for waves 4. The resistance boxes (red) are expected to stop price action from moving any higher.
BTC/USD bullish pinbar confirms double bottom?
Bitcoin (BTC/USD) has printed another bullish candlestick pinbar:
-
The BTC/USD bullish pinbar is the second one in recent history and offers a double bottom pattern at the support trend lines (green).
-
We changed our Elliott Wave analysis to a bearish ABC (orange) pattern within wave B (green), compared to last week.
-
Now price action is expected to make a bullish bounce within wave C (green). The Fibonacci levels are the main targets.
-
A breakout above the resistance trend lines (orange) would confirm the development within that wave C (green).
-
A larger ABC (pink) corrective pattern is expected within wave 4 (purple).
Dow Jones Index sinks again at heavy resistance
The US30 made a strong bearish bounce at the resistance zone. Let’s review what it means for the US30 chart:
-
The US30 weekly chart was unable to break above the resistance zone (orange). In fact, price action showed a strong bearish rejection (bearish weekly candle).
-
The bearish rejection confirms a lower high. Price action already made several lower lows so a downtrend is already established.
-
That said, the angle of the trend is still shallow and could easily fit within a waev 4 pattern.
-
For a stronger and more serious downtrend to be confirmed, price action will need to break below the support trend line (green).
-
Eventually a retest and break below the 50% Fibonacci is needed before a clear bearish reversal is expected (red arrows).
-
The uptrend (green arrow) is only a factor if price action is able to break above the resistance box (orange).
The analysis has been done with the indicators and template from the SWAT method simple wave analysis and trading. For more daily technical and wave analysis and updates, sign-up to our newsletter
Author

Chris Svorcik
Elite CurrenSea
Experience Chris Svorcik has co-founded Elite CurrenSea in 2014 together with Nenad Kerkez, aka Tarantula FX. Chris is a technical analyst, wave analyst, trader, writer, educator, webinar speaker, and seminar speaker of the financial markets.


