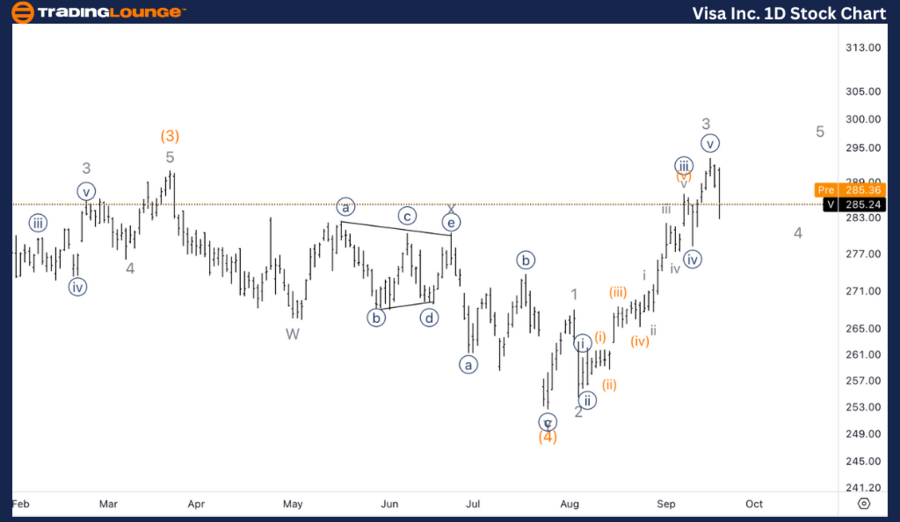
V Elliott Wave Analysis Trading Lounge daily chart

V Elliott Wave technical analysis

Function: Trend.

Mode: Impulsive.

Structure: Motive.

Position: Wave (5).

Direction: Upside into wave (5).

Details: Looking for ATHs within wave (5) above 300$ which is Trading Level3, at which point we could either complete (5) or 1 of (5).

V Elliott Wave technical analysis – Daily chart

This wave has the potential to either complete Wave (5) or act as Wave 1 of (5), signaling the beginning of a larger bullish cycle. As Visa approaches the $300 level, traders should watch for price action signals indicating either a continuation higher or a corrective pullback, depending on whether Wave (5) concludes or extends further. 

Visa

V Elliott Wave technical analysis

Function: Trend.

Mode: Impulsive.

Structure: Motive.

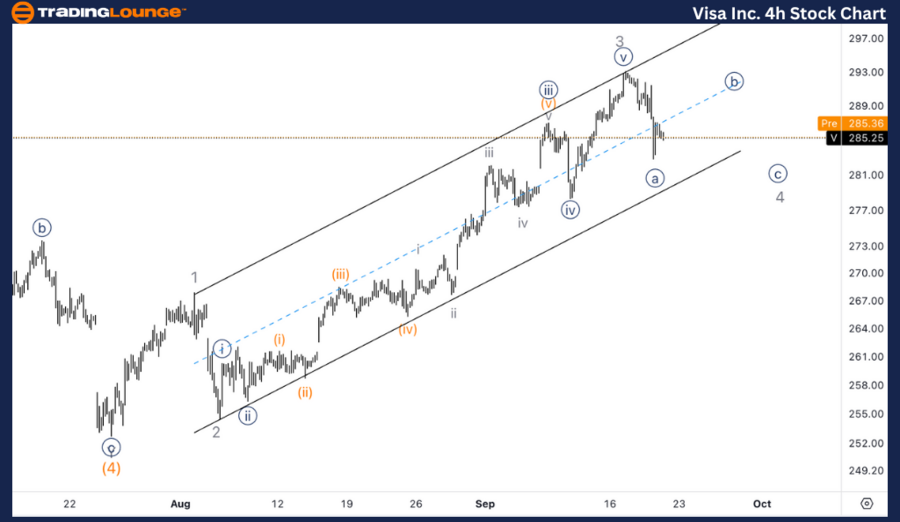
Position: Wave {a} of 4.

Direction: Looking for completion in wave 4.

Details: Looking for further developments within wave 4 as we could be headed towards 280$ which is also where previous wave {iv} stands.

V Elliott Wave technical analysis – Four-hour chart 

In the 1-hour chart, Visa is in Wave {a} of 4, suggesting that it is in the midst of a correction within Wave 4. The stock could be heading towards $280, a key support level that aligns with the previous Wave {iv} structure. This price level also serves as a potential retracement zone, where the correction could find a bottom before resuming the uptrend.

Chart


In this Elliott Wave analysis of Visa Inc. (V) as of September 20, 2024, we will explore the stock’s current price movements and wave structure to provide traders with key insights into potential trading opportunities. We will review both the daily and 1-hour charts to give a detailed view of Visa's current trend. 

Visa Inc.(V) Elliott Wave technical analysis [Video]

Share: Feed news

As with any investment opportunity there is a risk of making losses on investments that Trading Lounge expresses opinions on.

Historical results are no guarantee of future returns. Some investments are inherently riskier than others. At worst, you could lose your entire investment. TradingLounge™ uses a range of technical analysis tools, software and basic fundamental analysis as well as economic forecasts aimed at minimizing the potential for loss.

The advice we provide through our TradingLounge™ websites and our TradingLounge™ Membership has been prepared without considering your objectives, financial situation or needs. Reliance on such advice, information or data is at your own risk. The decision to trade and the method of trading is for you alone to decide. This information is of a general nature only, so you should, before acting upon any of the information or advice provided by us, consider the appropriateness of the advice considering your own objectives, financial situation or needs. Therefore, you should consult your financial advisor or accountant to determine whether trading in securities and derivatives products is appropriate for you considering your financial circumstances.

Recommended content


Recommended content

Editors’ Picks

EUR/USD holds on to gains near fresh 2025 highs

EUR/USD holds on to gains near fresh 2025 highs

The EUR/USD holds near the fresh 2025 peak in the 1.1640 area, as optimism about a truce in the Middle East keeps fueling demand for high-yielding assets. Powell’s testimony before Congress did not help the US Dollar.
 

USD/JPY extends retracement from weekly peaks

USD/JPY extends retracement from weekly peaks

The Japanese Yen appreciated sharply against the Greenback, with USD/JPY down roughly 300 pips from its Monday peak. Downward pressure is likely to increase on a break below 144.50.

Gold stabilized around $3,310 as mood remains upbeat

Gold stabilized around $3,310 as mood remains upbeat

The bright metal briefly traded below $3,300 on Tuesday, as market players welcomed a de-escalation in the Middle East conflict. Hawkish remarks from Fed Chair Powell added to the upbeat mood.

Three signs altcoin season is dead and traders are betting on top 3 cryptos

Three signs altcoin season is dead and traders are betting on top 3 cryptos

The altcoin season is a time period during which 75% of the altcoins ranked in the top 50 cryptos by market capitalization outperform Bitcoin in a 90-day timeframe. Traders await the altcoin season every market cycle to take profits on alternative tokens as capital rotates from Bitcoin to other cryptos. 

Could Iran block the Strait of Hormuz? Why Oil is on edge after US strikes

Could Iran block the Strait of Hormuz? Why Oil is on edge after US strikes

As the Israel-Iran conflict reaches new heights, an old threat is coming back to haunt the markets: that of the closure of the Strait of Hormuz. This narrow arm of the sea in the Persian Gulf, wedged between Iran to the north and the United Arab Emirates and Oman to the south, is much more than a simple sea passage.

The Best brokers to trade EUR/USD

The Best brokers to trade EUR/USD

SPONSORED Discover the top brokers for trading EUR/USD in 2025. Our list features brokers with competitive spreads, fast execution, and powerful platforms. Whether you're a beginner or an expert, find the right partner to navigate the dynamic Forex market.

Forex MAJORS

Cryptocurrencies

Signatures

Best Brokers of 2025