Gold Price Forecast: XAU/USD holds around $2,330 after dismal US data

XAU/USD Current price: $2,329.29
- The US Gross Domestic Product missed expectations, spurring concerns.
- Inflationary pressures increased in the United States in the first quarter of the year.
- XAU/USD holds on to modest intraday gains, with the bearish case losing steam.
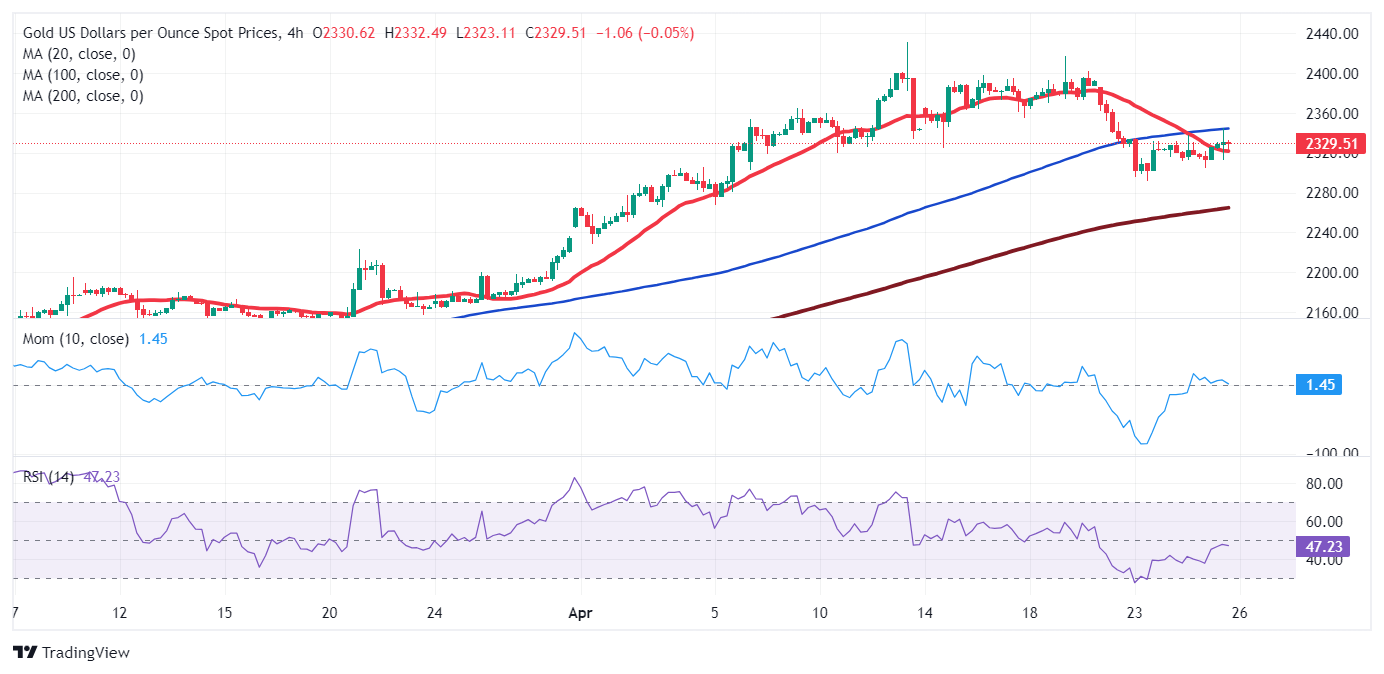
Spot Gold remains confined to familiar levels, trading at around $2,330 in the American afternoon. XAU/USD experienced some volatility following the release of United States (US) macroeconomic data, which put a sour taste in traders’ mouths. The country released the preliminary estimate of the Q1 Gross Domestic Product, which showed the economy grew at an annual pace of 1.6% in the three months to March, missing the expected 2.5% and much weaker than the 3.4% posted in the last quarter of 2023.
Furthermore, the Bureau of Economic Analysis (BEA) reported that the Personal Consumption Expenditures (PCE) Price Index rose at a 3.4% annualized pace for the quarter, much higher than the previous 1.8% and the biggest gain in a year. In a few words, growth slowed, but the economy continued expanding while inflation picked up. Such a scenario further delays a potential rate cut from the Federal Reserve (Fed). The US Dollar surged while Wall Street plummeted as an immediate reaction to the news. The USD, however, was unable to preserve its momentum as US data throughout the week has been disappointing.
The initial fears receded, and US indexes trimmed part of their losses but retain the red. Nevertheless, continued demand for safety maintained XAU/USD evenly balanced.
XAU/USD short-term technical outlook
From a technical point of view, XAU/USD has made little progress. It is trading just above the 23.6% Fibonacci retracement of the $1,996.06/$2,431.43 rally. In the daily chart, a bullish 20 Simple Moving Average (SMA) stands around the same level, with the price struggling to extend gains above it. The longer moving averages, in the meantime, maintain their bullish slopes far below the shorter one. Finally, the Momentum indicator keeps heading south at around its 100 level, but the Relative Strength Index (RSI) indicator turned north within positive levels.
Generally speaking, Gold tends to benefit against the USD in a risk-averse environment, which skews the risk to the upside. In the near term, and according to the 4-hour chart, XAU/USD offers a neutral-to-bullish stance. The Momentum indicator is losing its upward strength but holds above its 100 line, while the RSI indicator consolidates around 47, reflecting the absence of apparent directional strength. At the same time, a mildly bullish 100 SMA provides dynamic resistance at around $2,343.50, while the 20 SMA aims lower below the current level.
Support levels: 2,310.00 2,295.20 2,282.90
Resistance levels: 2,343.50 2,361.55 2,372.90
Author

Valeria Bednarik
FXStreet
Valeria Bednarik was born and lives in Buenos Aires, Argentina. Her passion for math and numbers pushed her into studying economics in her younger years.