|premium|

EUR/USD Price Forecast: Corrective advance to soon be over

EUR/USD Current price: 1.0409

  • United States annualized growth was upwardly revised in Q3 to 3.1%
  • The Federal Reserve's hawkish cut maintains the US Dollar near fresh multi-week highs.
  • EUR/USD recovery seems corrective, near-term picture supports another leg lower.

The EUR/USD pair trimmed part of the Fed-inspired losses and traded in the 1.0410 price zone ahead of the American opening on Thursday. The pair fell to 1.0343 following the United States (US) Federal Reserve (Fed) monetary policy announcement on Wednesday. The Fed decided to cut the benchmark interest rate by 25 basis points (bps) as expected, delivering alongside a quite hawkish message heading into the new year.

Additionally, the Summary of Economic Projections (SEP) showed policymakers decided to scale back the number of cuts they expect to make next year. Officials also project a strong economy but do not see inflation reaching their 2% goal until 2027. Ten out of the seventeen voting members foresee two rate cuts in 2025, while three members estimated just one trim. Even further, Chairman Jerome Powell said the decision was a “close call” as some voting members would prefer to leave rates unchanged.

Wall Street collapsed with the hawkish cut, leading to losses among its overseas counterparts on Thursday.

Data-wise, the EU published the October Current Account, which posted a seasonally adjusted surplus of €26 billion, missing the expected €33.5 billion. Across the pond, the United States released the final Q3 Gross Domestic Product (GDP) estimate, which suffered an upward revision. Annualized growth was confirmed at 3.1%, against the 2.8% previously estimated. Meanwhile, Initial Jobless Claims for the week ended December 13 declined to 220K from 242K in the previous week, also beating the expected 230K. The figures confirmed the Fed’s stance.

EUR/USD short-term technical outlook

US data initially backed the Greenback, but an uptick in stocks helps EUR/USD to remain afloat. Technical readings in the daily chart, however, show the ongoing advance could be just corrective, given that the pair trades below all its moving averages. Even further, the 20 Simple Moving Average (SMA) heads south below also bearish 100 and 200 SMAs. Technical indicators, in the meantime, barely bounced from their recent lows, lacking enough upward strength to support another leg higher.

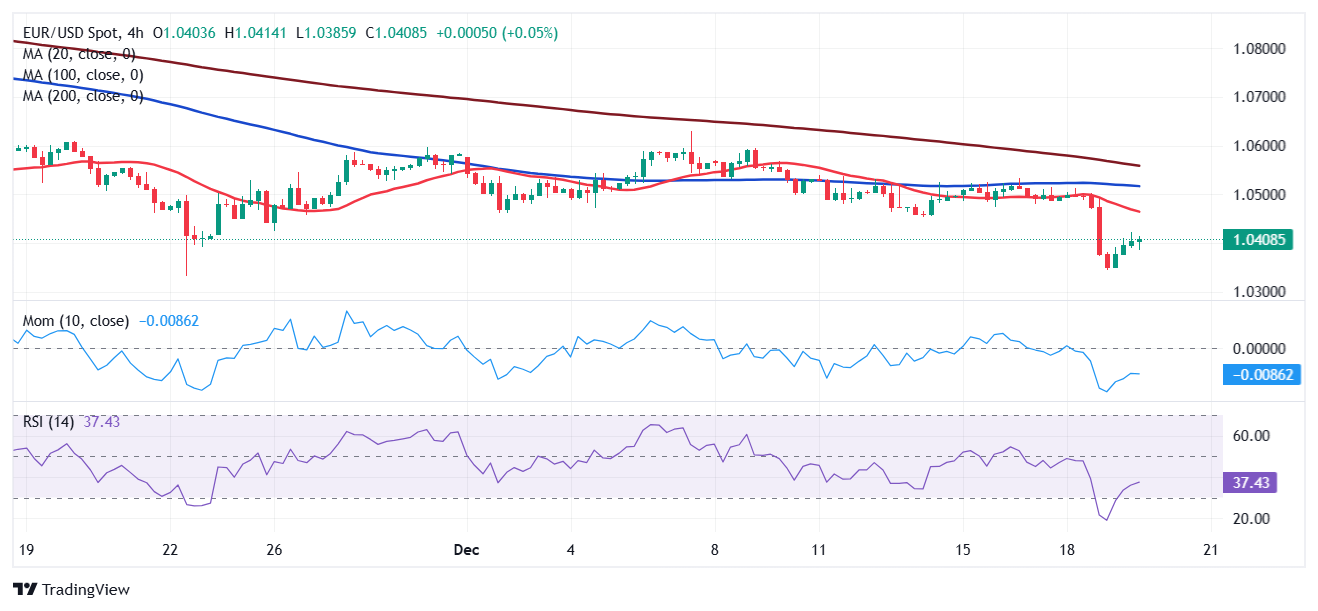
The near-term picture suggests that EUR/USD may soon resume its slide. Technical indicators in the 4-hour chart have corrected extreme oversold conditions before losing their upward strength well below their midlines. Finally, the 20 SMA accelerated lower below the longer ones while above the current level.

Support levels: 1.0375 1.0330 1.0290  

Resistance levels: 1.0440 1.0485 1.0520

Premium

You have reached your limit of 3 free articles for this month.

Start your subscription and get access to all our original articles.

Subscribe to PremiumSign In

Author

Valeria Bednarik

Valeria Bednarik was born and lives in Buenos Aires, Argentina. Her passion for math and numbers pushed her into studying economics in her younger years.

More from Valeria Bednarik
Share:

Editor's Picks

AUD/USD bounces off weekly low on Israel-Lebanon ceasefire

AUD/USD recovers slightly from the weekly low during the Asian session on Thursday as a new Israel-Lebanon ceasefire keeps a lid on the safe-haven US Dollar. Meanwhile, the US and Iran remain at odds over key issues, which, along with hawkish Fed expectations, act as a tailwind for the buck. Furthermore, diminishing odds of an RBA rate hike in June cap the currency pair as traders keenly await the US NFP report on Friday.

USD/JPY remains close to 160.00 intervention threshold on Mideast tensions

USD/JPY struggles to find acceptance above 160.00 and retreats from a one-month high during the Asian session on Thursday amid fears that authorities will step in again to prop up the Japanese Yen. Furthermore, a new Israel-Lebanon ceasefire caps the US Dollar and supports the currency pair. However, renewed US-Iran tensions favor the USD bulls amid Fed rate hike bets and also hold back the JPY bulls from placing aggressive bets amid economic risks stemming from the Middle East conflict, suggesting that dips are likely to be bought into.

Gold bounces off one-week low; upside seems capped on Iran uncertainty

Gold recovers from a one-week low touched during the Asian session on Thursday, as news of an Israel-Lebanon ceasefire acts as a headwind for the safe-haven US Dollar. However, renewed hostilities in the Gulf, along with stalled US-Iran peace talks, keep geopolitical risks in play and should support the USD. Moreover, US-Iran tensions remain supportive of higher Crude Oil prices, fueling inflationary concerns and bolstering bets for higher interest rates for longer. This should cap the non-yielding bullion and warrants caution for bulls.


Bitcoin drops below $65K amid reinforced bear market signals

Bitcoin dipped further below $65,000 on Wednesday, with onchain data from Glassnode signaling a market firmly in a bear phase. The decline has pushed prices back into a key valuation range between the Realized Price and the True Market Mean. Glassnode noted that a key shift in market structure has also emerged.

The upside-down math of debt
In 2010, Professors Carmen Reinhart and Kenneth Rogoff published a paper, Growth in a Time of Debt, which instantly went viral. The main thesis of the paper was that once a government's debt-to-GDP ratio crosses above 90%, a financial crisis and default are around the corner.
Recession on paper: What really moves the Canadian Loonie now?

Statistics Canada handed the headline writers a gift and the analysts a headache. Real GDP shrank 0.1% on an annualized basis in the first quarter, and with the fourth quarter of 2025 revised down to a 1.0% contraction, that is two negative quarters in a row, the textbook definition of a technical recession and Canada's first since the pandemic.