S&P 500 update: Is it rally time?

In last week’s update, we concluded for the S&P500 (SPX)
-
There are no signs of a bear market.
-
Even if there is one, history shows us that each Bear market Is a Major Buying Opportunity (BIMBO) for those with a time horizon longer than a few days to weeks.
-
The SPX continues to follow a standard Fibonacci-based impulse pattern that began in March 2020, which we outlined several weeks ago.
Fast forward to Monday, when the new 52-week lows spiked to 1152. However, the current seven-week correction sits at -19.1% based on a closing basis, and yesterday, the index already rallied back to the levels from when our article was posted. Thus, the SPX is still not in a bear market. We can check off items (A) and (B) and move on to item (C).
Using the Elliott Wave (EW) Principle, we were tracking a standard Fibonacci-based impulse pattern off the March 2020 low, with the February all-time high (ATH) as the potential 3rd of a 3rd wave top (Wave-iii of W-3) and the current decline as the (Red) W-iv. See Figure 1 below.
A standard Fibonacci-based impulse pattern from the March 2020 low
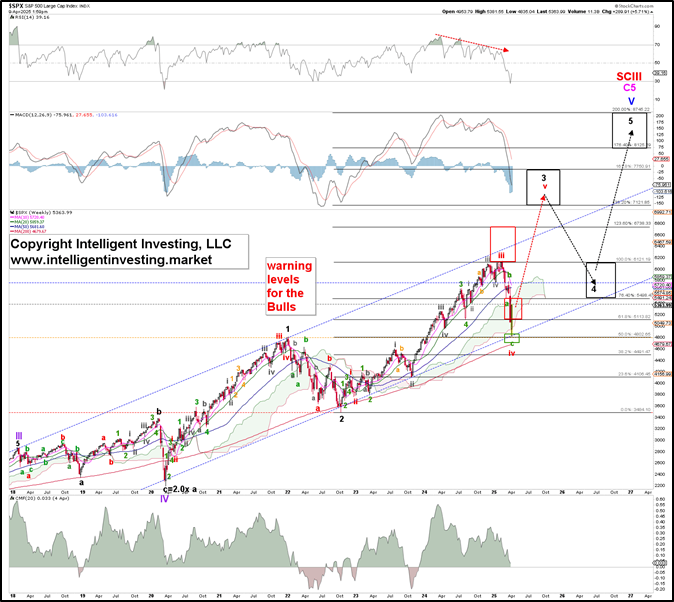
In that case, the 4th wave should ideally bottom at the 61.8% extension at $5,116. As such, we found last week that
“… the response to “Liberation Day” suggests that the green W-c of the red W-iv, ideally at $ 5,140 ± 20 when assuming a standard Fib-based impulse lower, should now be underway. This target zone is close to the ideal level of $ 5,116.”
On to Monday. The index dropped to as low as $4,835, exceeding the ideal $5,116 level by 5.5%. Extensions of waves can always happen but cannot be known beforehand. Hence, we start with the ideal Fibonacci-based impulse pattern, and when it is invalidated, we apply, in this case, an extended pattern. Therefore, “all we can do is anticipate, monitor, and adjust, if necessary.”
Thus, the current decline is slightly more profound than anticipated, putting the larger standard impulse pattern under pressure, although it has not been invalidated. As such, we must seek an alternative and present it in Figure 2 below.
A large ending diagonal pattern from the March 2020 low
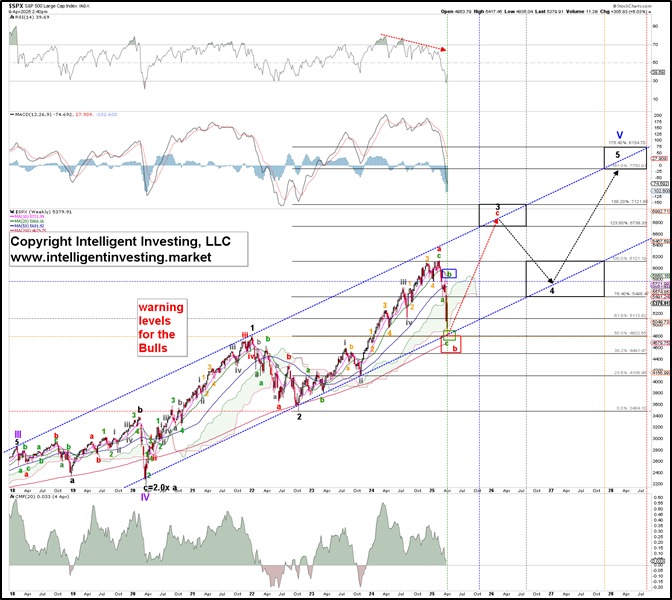
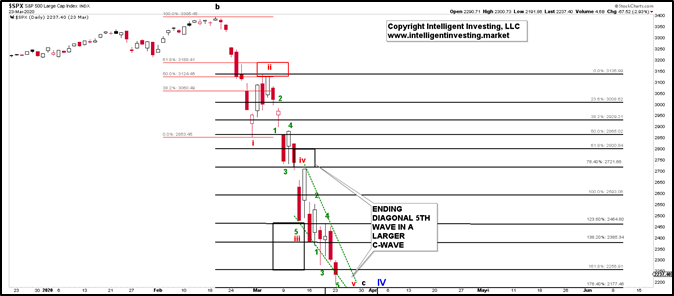
Allow us to explain. What we know is that the COVID-19 crash in 2020 was undeniably a five-wave sequence. See Figure 3 below. That crash was the c-wave of a larger irregular expanded flat (a-b-c = 3-3-5), the Primary 4th wave (blue W-IV), which started in 2018. See Figure 2 above.
The COVID-19 crash was a standard Fibonacci-based impulse C-wave
Thus, we must see five larger waves up from that March 2020 low as the (blue) W-V must subdivide into five (black 1, 2, 3, 4, 5) waves. There have only been three so far, and it’s now a matter of how these five waves progress/subdivide. We start our forecast with the standard Fibonacci-based impulse pattern, which tracked well until the current decline.
However, the bull market from the 2020 low can morph into an ending diagonal. In that case, the (black) 3rd wave comprises three waves: red W-a, -b, and -c. This week’s low is almost a 50% retracement of the October 2022 low to the February 2025 ATH rally: $4,835 vs. $4,819. That is more typical B-wave behavior as 4th waves tend to retrace ~38.2%, which is why we were looking for the $5,116 level. Moreover, the recent 2+ year rally can be counted as three (green) waves. Lastly, B-waves comprise three waves, and thus far, the decline from the ATH into Monday’s low was three (green) waves (a-b-c). Therefore, from October 2022 till now, it has counted well as the red W-a and W-b. See Figure 2.
Although the overall pattern between the standard impulse pattern in Figure 1 and the ending diagonal path in Figure 2 appear similar, note the differences in target zones for the 3rd and 5th waves: $7,121-7,750 vs. $6,738-7,121 and $8,125-8,745 vs. $7,750-8,125; respectively.
We want to conclude like last week: Take a deep breath and zoom out. There are still no signs of a bear market. Even if there is one, history shows us that each Bear market is a Major Buying Opportunity (BIMBO) for those with a time horizon longer than a few days to weeks. Although the standard Fibonacci-based impulse pattern that began in March 2020 is under pressure, an ending diagonal scenario still allows for the SPX to reach ideally $6,738-7,121 before a more extensive correction should start.
Author

Dr. Arnout Ter Schure
Intelligent Investing, LLC
After having worked for over ten years within the field of energy and the environment, Dr.


