EUR/USD Forecast: Bullish moves lack conviction so far
- EUR/USD resumed the decline and approached 1.0850.
- The US Dollar extended its rebound on robust data.
- The US ADP report came in below expectations in May.

The US Dollar (USD) traded with decent gains on Wednesday, keeping the downside pressure on the risk-related sector well and sound and forcing EUR/USD to retreat further and revisit the area near 1.0850, or two-day lows.
In fact, the pair added to Tuesday’s retracement on the back of the Greenback's fresh upward trend despite a continued decline in US yields across different maturity periods.
Despite we are transiting the Fed’s “blackout” period, it is worth recalling that recent hawkish remarks from Fed officials have sparked speculation that the Federal Reserve (Fed) may maintain its tight monetary policy stance longer than previously expected. However, disappointing US JOLTs Job Openings data in April published on Tuesday, and disheartening prints from the ADP Employment Change in May seem to have reignited speculation of a potential rate cut in November and December.
The CME Group's FedWatch Tool indicates a nearly 80% chance of lower interest rates by the November 7 meeting.
Despite stronger inflation estimates in Germany and the whole of the eurozone in May, the European Central Bank (ECB) is expected to cut interest rates at its next meeting on June 6. However, doubts persist about further rate reductions after the summer.
Looking ahead, the Eurozone's nascent economic recovery, coupled with a slowdown in the US economy, suggests a narrowing of the monetary policy gap between the Fed and the ECB, which should in turn limit the downside in EUR/USD.
Nevertheless, in the long term, given the increasing likelihood that the ECB will cut rates before the Fed, further EUR/USD depreciation should be anticipated in the coming months.
EUR/USD daily chart
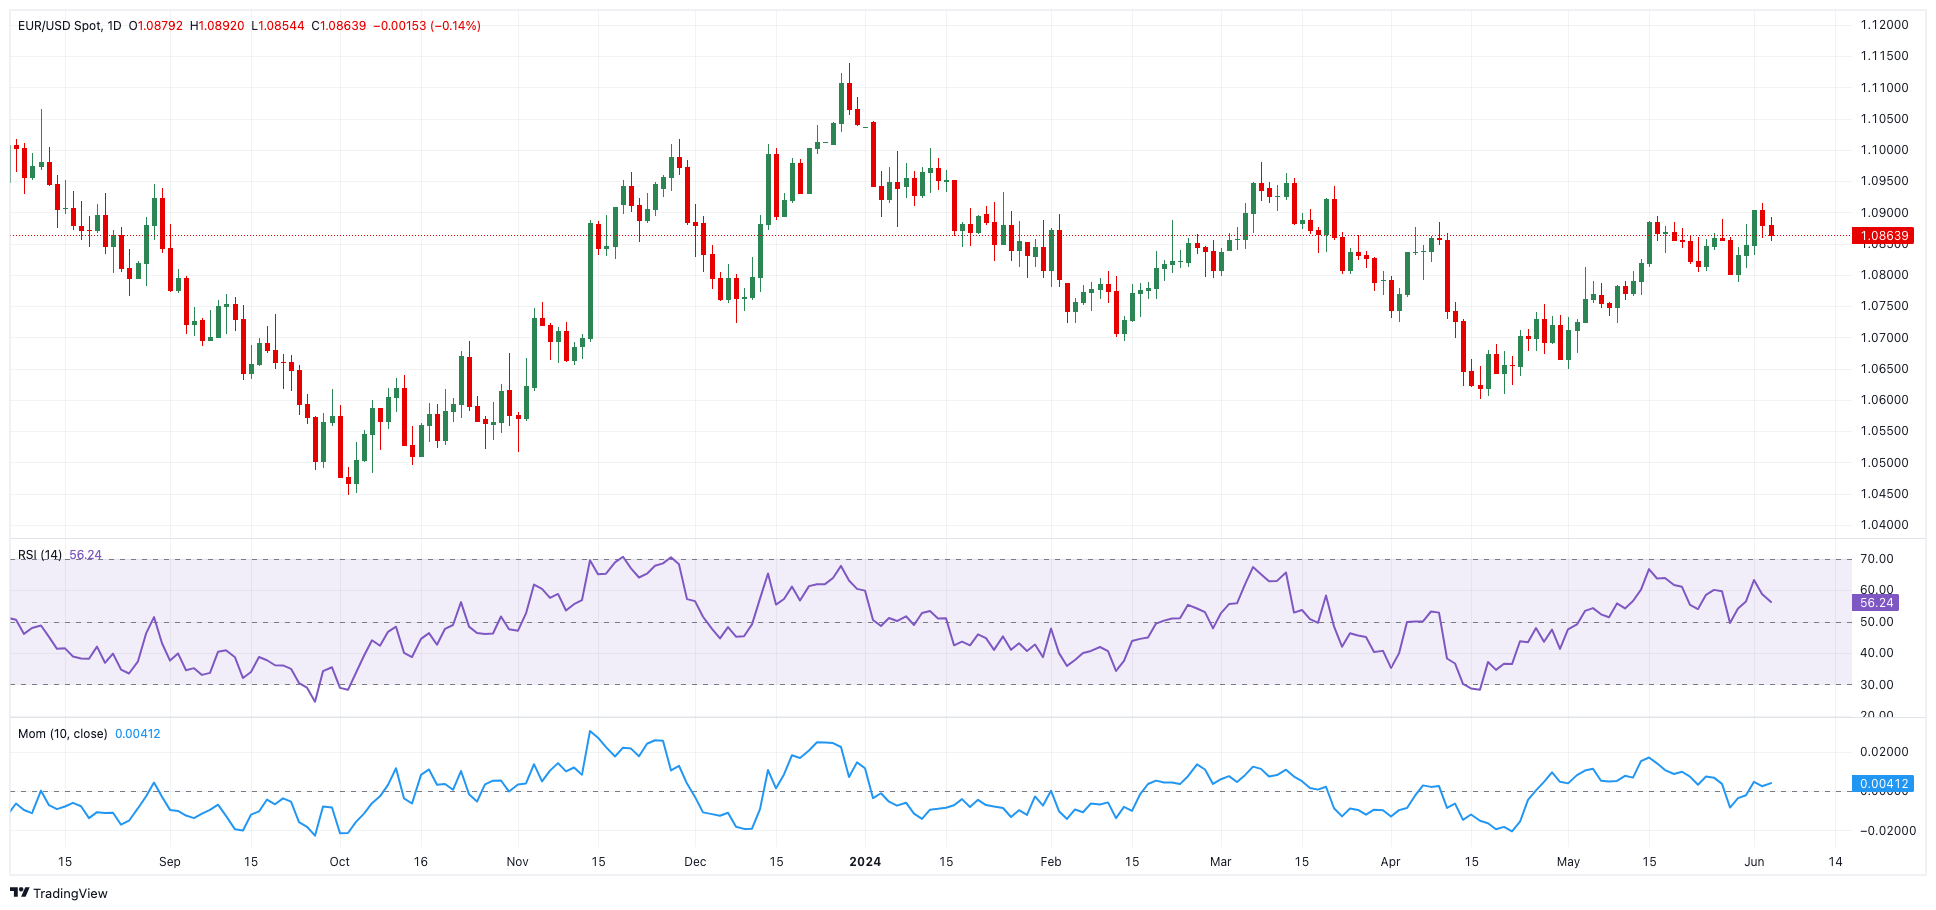
EUR/USD short-term technical outlook
If bulls maintain control, EUR/USD may test the June high of 1.0916 (June 4), then the March top of 1.0981 (March 8) and the weekly peak of 1.0998 (January 11), all before reaching the important 1.1000 level.
If the bearish tone returns, the pair may initially retest the weekly low of 1.0788 (May 30), which is supported by the 200-day SMA. A drop below this area may push spot to the May low of 1.0649 (May 1), ahead of the 2024 bottom of 1.0601 (April 16).
So far, the 4-hour chart reveals some consolidative development in the near term. The next downward obstacle is the 55-SMA (1.0851), followed by 1.0788 and 1.0766. On the positive side, 1.0916 comes out ahead of 1.0942. The relative strength index (RSI) dropped to about 50.
Premium
You have reached your limit of 3 free articles for this month.
Start your subscription and get access to all our original articles.
Author

Pablo Piovano
FXStreet
Born and bred in Argentina, Pablo has been carrying on with his passion for FX markets and trading since his first college years.


