Zilliqa Price Prediction: ZIL prepares for a 70% bull rally to $0.12
- Zilliqa price hints at a 70% surge as it breaks out of a bull flag pattern.
- Invalidation of the conflicting sell signal presented by the TD Sequential indicator is key to ZIL’s rally.
- Breaking through the $0.08 resistance will help confirm the bullish outlook, leading to a run-up to $0.12.

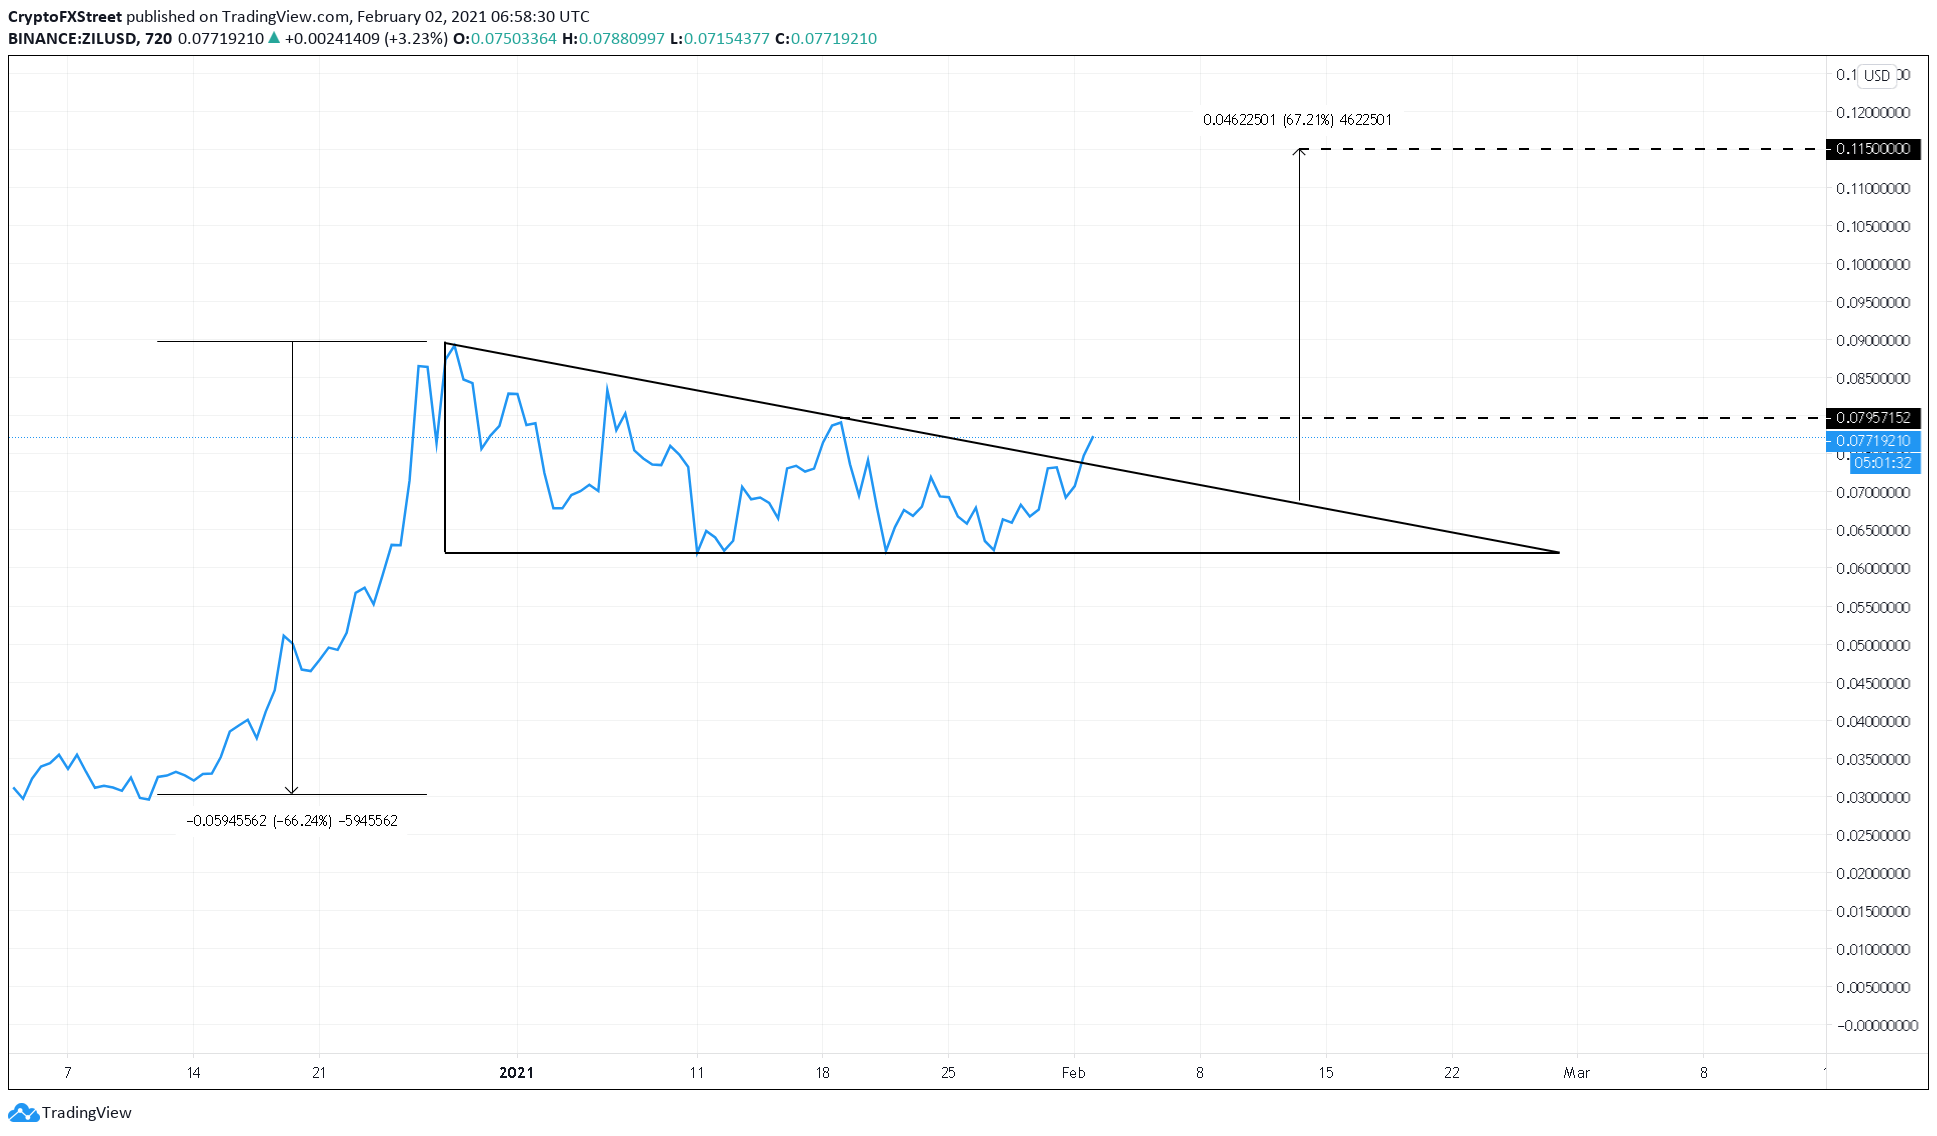
Zilliqa price recently broke out of the bull flag, indicating that it is ready for higher highs. A decisive close above a critical resistance level can quickly push ZIL's market value by 70%, but a failure will drag it down into stagnation.
Zilliqa price at crossroads as bulls fight bears for control
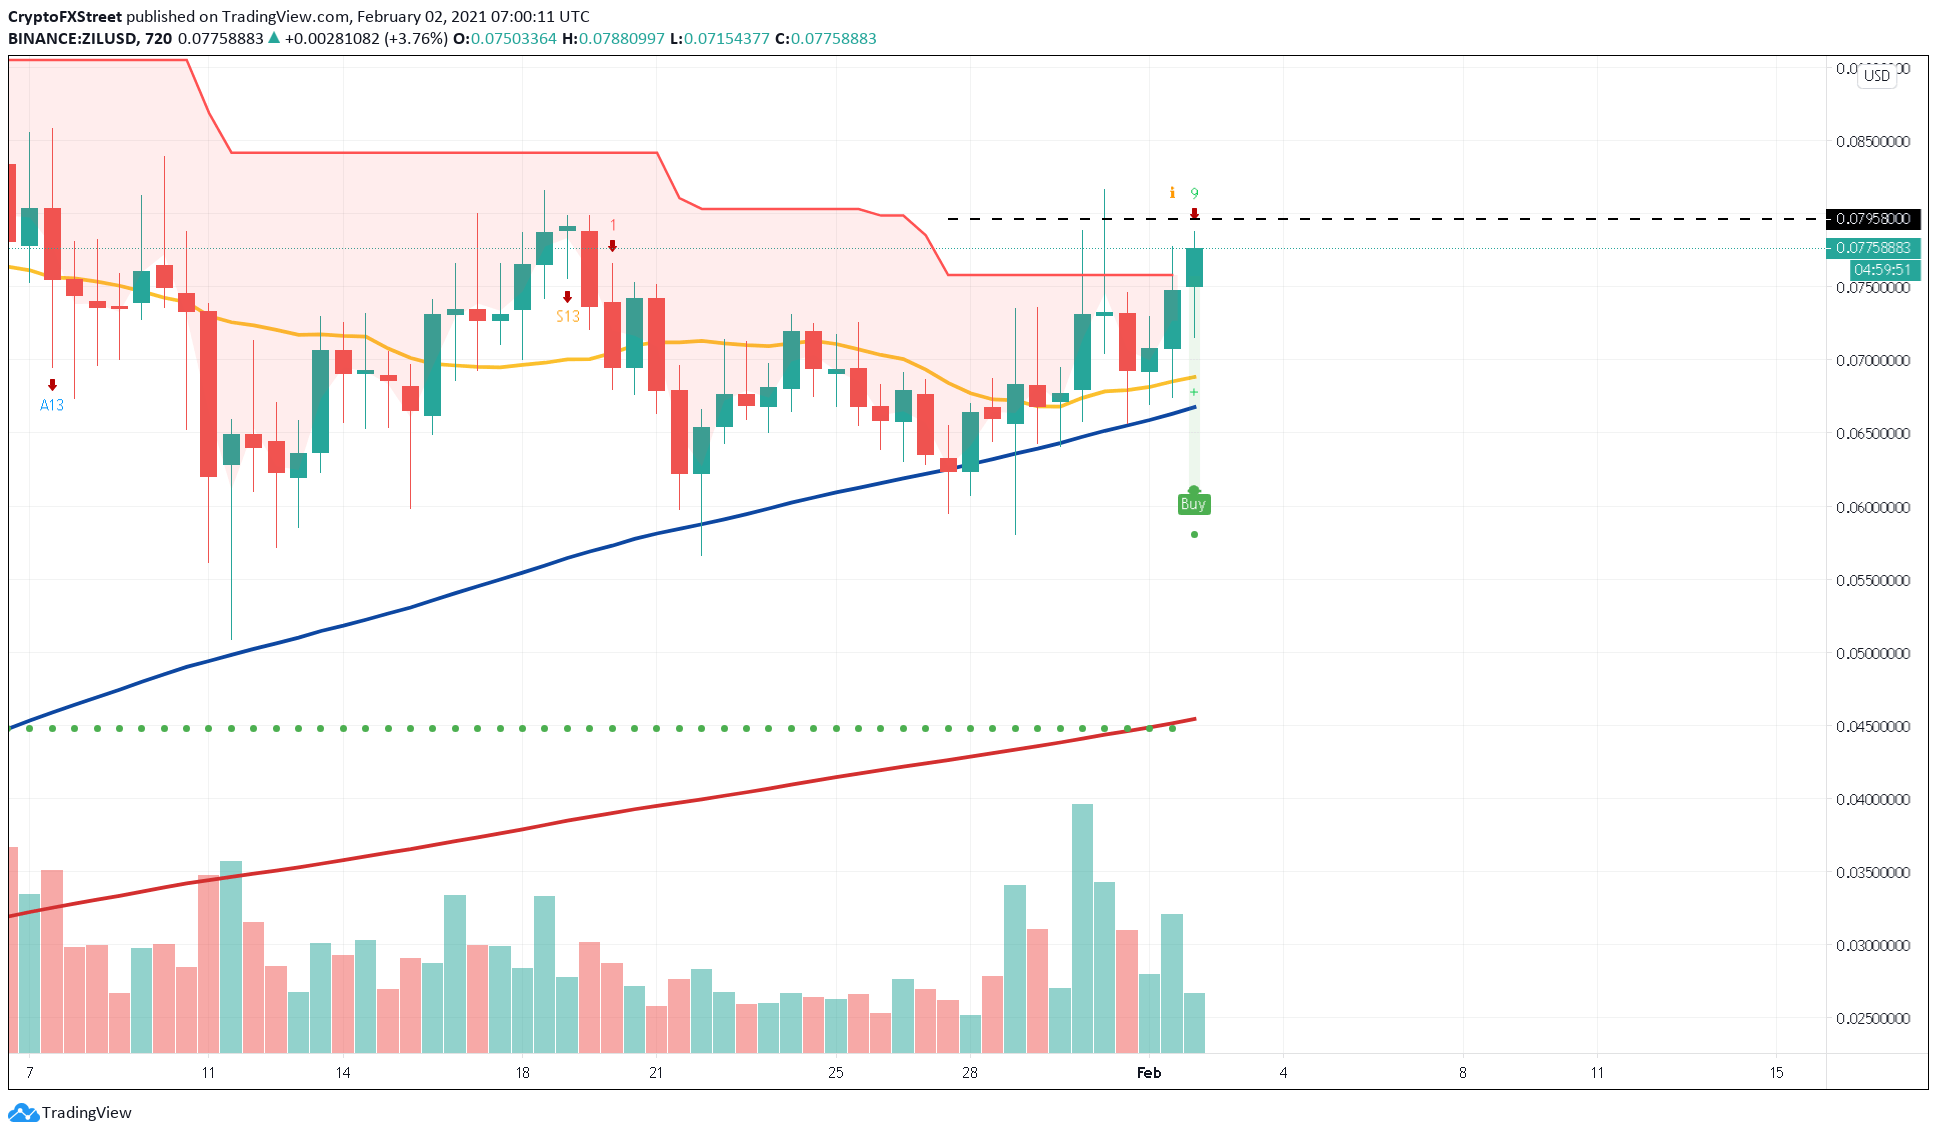
Zilliqa price cut through the 50 twelve-hour SMA after bouncing from the 100 twelve-hour SMA, showing intense buying pressure in the market. The uptick caused a breakout from a bull flag pattern on a 12-hour chart, triggering an opportunity for a 70% rise in ZIL's market value.
Now, Zilliqa price needs to stay above the recent highs formed at $0.08 to take advantage of the bullish opportunity.
ZIL/USDT 12-hour chart
A successful close above the $0.08 resistance barrier will trigger a buy-signal by the SuperTrend indicator within the same time frame. Slicing through this crucial price hurdle will also invalidate the TD Sequential indicator’s sell signal presented in the form of a green nine candlestick.
Therefore, investors must pay close attention to the $0.08 resistance since it will determine whether or not Zilliqa price will skyrocket by 70% to meet the bull flag’s target at $0.12.
ZIL/USDT 12-hour chart
It is worth mentioning that a rejection from the $0.08 resistance level would help confirm the sell signal presented by the TD setup and result in a one to four 12-hour candlestick retracement. On its way down, ZIL may find support around the 50 or 100 twelve-hour SMA.
Author

Akash Girimath
FXStreet
Akash Girimath is a Mechanical Engineer interested in the chaos of the financial markets. Trying to make sense of this convoluted yet fascinating space, he switched his engineering job to become a crypto reporter and analyst.


