|

Zilliqa Price Prediction: ZIL prepares to skyrocket by more than 70% towards $0.12

  • Zilliqa breaks out of a bull flag pattern, pointing toward a rise to $0.12.
  • ZIL/USD might revisit the 50 SMA support on the 4-hour chart before breakout comes into the picture.

Zilliqa seems to be getting ready for a massive elevation to highs around $0.12. The expected breakout follows a breakdown from the recent December peak at $0.106. For now, the least resistance path is upwards especially with the critical hurdle in the rearview.

Zilliqa nurtures the breakout to $0.12

ZIL has already stepped out of a bull flag pattern that appeared on the daily chart. The pattern forms after an asset price action extend considerably upwards followed a period of consolidation. The breakout from the bull flag often results in a powerful move higher, equaling the length of the flag pole. Therefore, if buying volume continues to rise behind the Zilliqa, the price will resume the uptrend targeting $0.12.
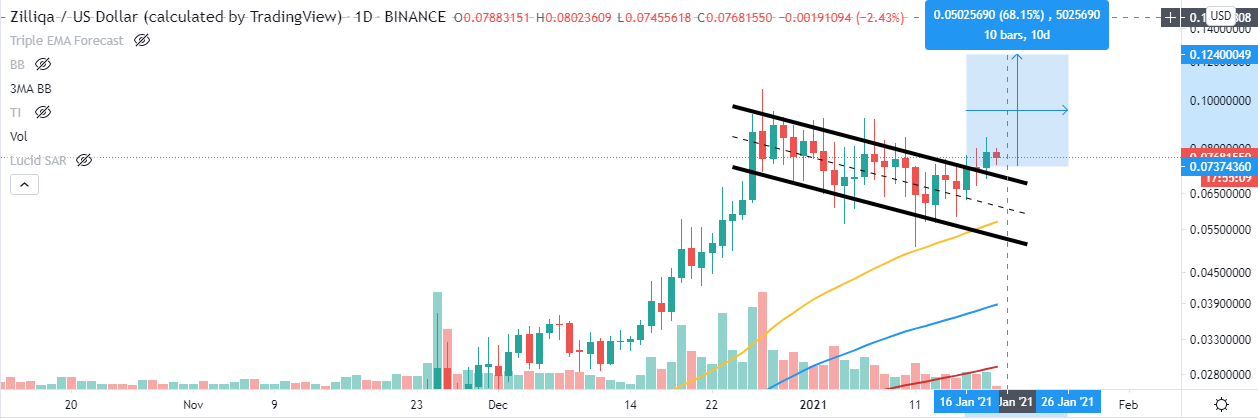
ZIL/USD chart

ZIL/USD daily chart

On the other hand, it is worth mentioning that the 4-hour chart shows that ZIL/USD is likely to retrace before embarking on the discussed upswing. Initial support will be provided by the 50 Simple Moving Average. If push comes to shove, the 100 SMA will come in handy, preventing losses under $0.07.

ZIL/USD 4-hour chart

ZIL/USD 4-hour chart

At the moment, breaking above $0.08 is key to the expected uptrend. Therefore, a daily close at this level, may call for more buy orders, thereby increasing the volume behind Zilliqa and setting it up for the anticipated rally.

Author

John Isige

John Isige

FXStreet

John Isige is a seasoned cryptocurrency journalist and markets analyst committed to delivering high-quality, actionable insights tailored to traders, investors, and crypto enthusiasts. He enjoys deep dives into emerging Web3 tren

More from John Isige
Share:

Editor's Picks

Bitcoin Weekly Forecast: BTC retreats as macro headwinds grow
Bitcoin (BTC) remains under pressure, down over 4% this week and trading around $76,900 at the time of writing on Friday. Institutional demand shows signs of weakness as spot BTC Exchange Traded Funds (ETFs) are on track to end their three-week inflow streak, recording nearly $500 million in net outflows through Thursday.
XRP falls toward key support as macro uncertainty, weak momentum cap recovery
Ripple (XRP) falls below $1.33 on Friday, marking the third consecutive day of declines. The token continues to track the broader cryptocurrency market downturn, with investors closely monitoring heightened macroeconomic uncertainty ahead of the United States (US) Consumer Price Index (CPI) release and next week’s Federal Reserve (Fed) monetary policy decision.
Crypto Today: Bitcoin, Ethereum, XRP stabilize at lower levels amid ETF outflows and macroeconomic risks
The broader cryptocurrency market is rising on Friday, with Bitcoin (BTC) trading above $77,000 after testing lower support near $76,500. Ethereum (ETH) shows signs of stability, hovering above the support provided at $2,400 despite capped upside at $2,500. Meanwhile, Ripple (XRP) holds above $1.33 after three straight days of declines, reflecting growing headwinds due to macroeconomic uncertainty.
Bitcoin pulls back as another golden cross fails to deliver
Earlier this week, Bitcoin formed a golden cross, a technical signal that occurs when the price’s 50-day moving average rises above the 200-day moving average and is conventionally viewed as a precursor to a bullish rally. Historically, however, that’s often not been the case.
Bitcoin: BTC retreats as macro headwinds grow
Bitcoin (BTC) remains under pressure, down over 4% this week and trading around $76,900 at the time of writing on Friday. Institutional demand shows signs of weakness as spot BTC Exchange Traded Funds (ETFs) are on track to end their three-week inflow streak, recording nearly $500 million in net outflows through Thursday.

