Zilliqa Price Prediction: ZIL on the threshold for a 55% breakout
- Zilliqa is on the verge of a massive 55%, following the formation of a symmetrical triangle.
- A confirmed upswing above the 100 SMA might set ZIL on the recovery path to $0.028.

Zilliqa has retreated by 58% from the yearly high of $0.031 achieved in July. The token initially embraced support at 0.016 in August, which allowed the buyers to regain control over the price. From this anchor, ZIL recovered to $0.029. Unfortunately, selling pressure resumed and became unstoppable until just recently when ZIL embraced support at $0.013.
Zilliqa on the verge of a massive breakout
The daily chart for ZIL/USD brings into the picture a symmetrical triangle pattern. The lower trendline was instrumental in mitigating downward price action in September and October. However, the upper limit of the triangle capped the price movement to the north.
Meanwhile, ZIL is trading at $0.018 amid a developing bullish momentum. Trading above the 100 SMA will boost the bulls' efforts, perhaps even result in a 55% breakout to $0.028. An expected increase in the demand for this token will validate the bullish outlook.
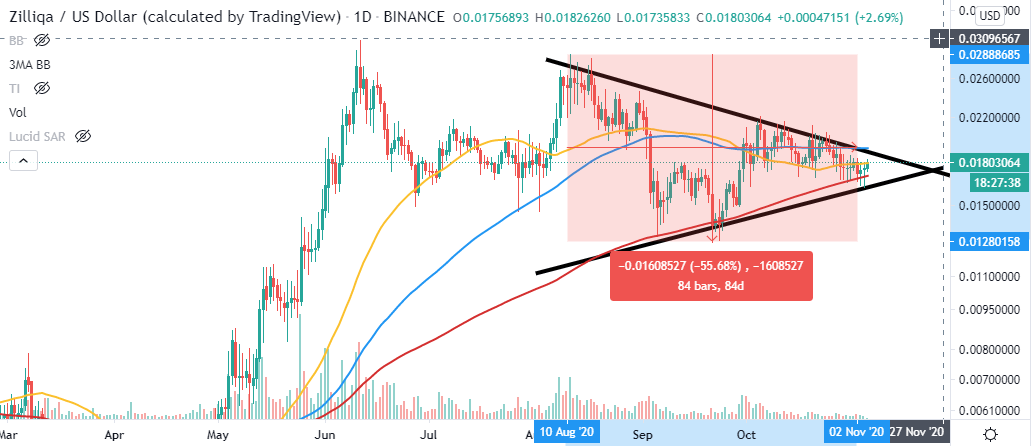
ZIL/USD daily chart
The 4-hour chart highlights the formation of a descending parallel channel. Zilliqa has already broken above the short-term channel's upper boundary, adding credence to the bullish outlook. Moreover, the Moving Average Convergence Divergence (MACD) is almost crossing above the midline. Although the MACD is a lagging indicator, it helps to point out the trend's general direction.
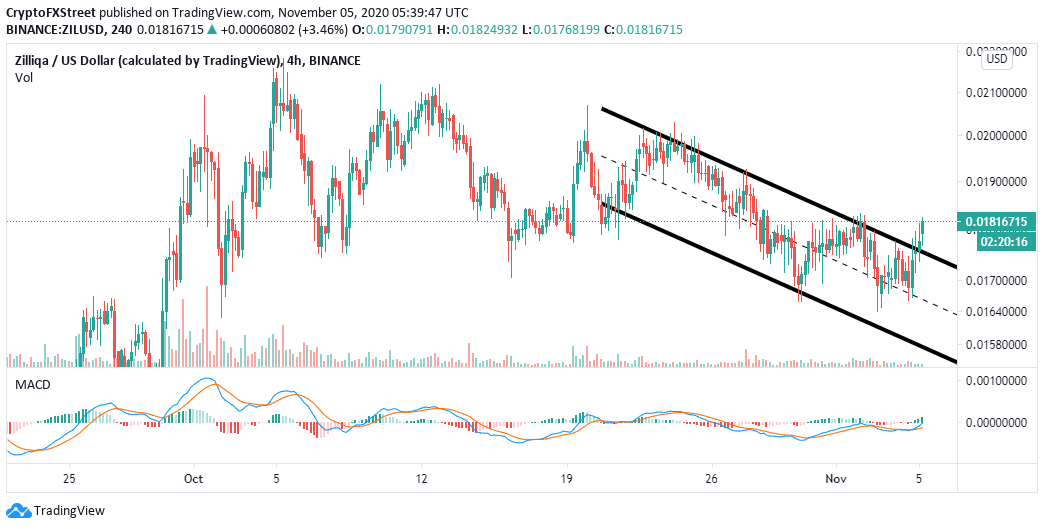
ZIL/USD 4-hour chart
It is worth noting that Zilliqa must break and hold above the 50-day SMA to validate the uptrend. On the other hand, if the price reverses under the 200-day SMA, Zilliqa may plummet by 55%, as projected by the symmetrical triangle. Therefore, the market participants must wait for a clear breakout of either the support or resistance to benefit from the potential significant price movement.
Author

John Isige
FXStreet
John Isige is a seasoned cryptocurrency journalist and markets analyst committed to delivering high-quality, actionable insights tailored to traders, investors, and crypto enthusiasts. He enjoys deep dives into emerging Web3 tren


