Zilliqa Price Analysis: ZIL goes up by ~45% since September 21
- Zilliqa announced that non-custodial staking will go live on the mainnet on October 14.
- The announcement has possibly triggered the holders into a buying a frenzy.

Zilliqa has strung together two straight bullish days. Previously on September 21, the price ($0.0137) reached its lowest value since May 20, 2020. Since then, the "Ethereum killer," has gone by nearly 43%.
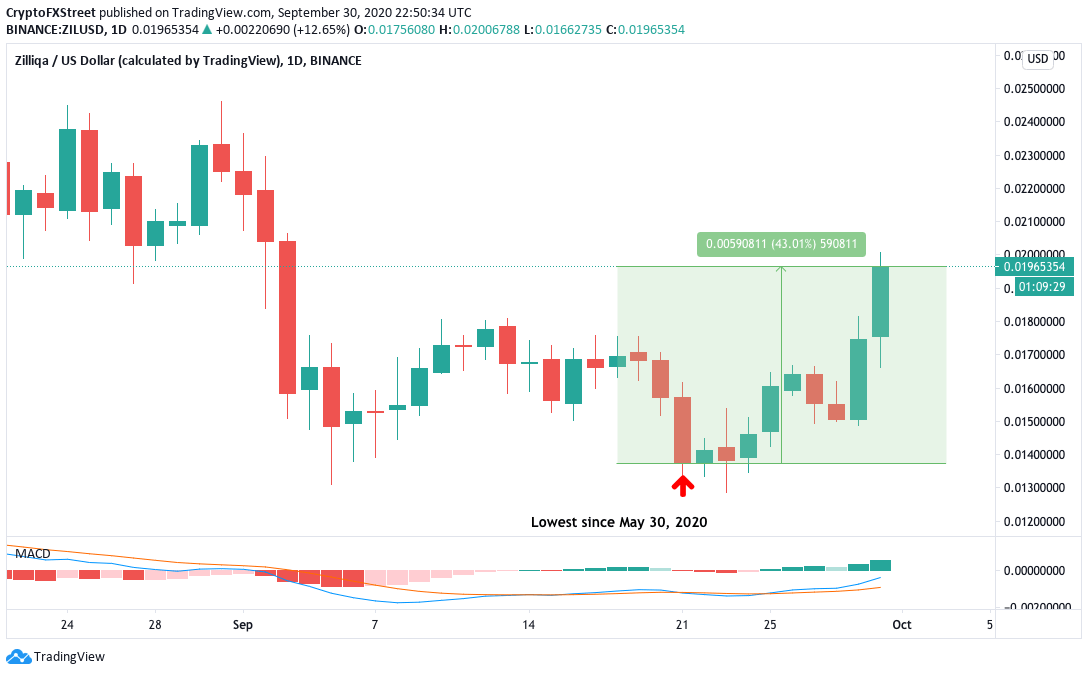
The MACD suggests that bulls currently have market momentum on their side, so further positive price action is expected.
So, what triggered this bullish action?
Last week, Zilliqa announced that non-custodial staking will go live on the mainnet on October 14. This has likely triggered a buying frenzy among the holders who are accumulating as much as possible before participating in the staking program. Zilliqa is one of the most promising projects in the space with solid fundamentals, backed by a highly qualified team. As such, it makes sense as to why ZIL holders are solidifying their positions to benefit from the staking launch.
So, how far can this renewed bullish interest push the price up? For that, let’s take a more in-depth look at the daily price chart.
ZIL/USD daily chart
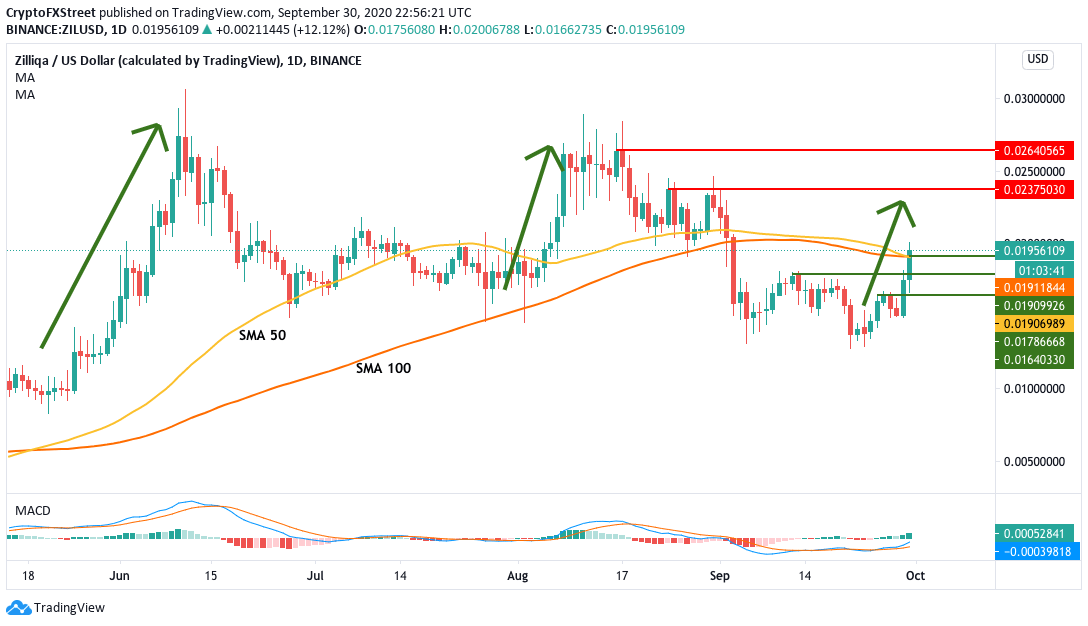
The first thing to notice here is that the SMA 100 is on the cusp of crossing over the SMA 50, to form a bearish cross pattern. However, by conquering the $0.0191 line, the buyers may have negated the bearish cross's effects. Historically speaking, ZIL has been characterized by sudden upward movements, followed by downfall and a period of consolidation.
Previously, from May 23, 2020, to June 10, 2020, the price jumped from $0.01 to $0.027. Following that, the price fell to $0.0176, over the next two months.
We saw the same sudden jump and gradual decline pattern repeating in in early-to-mid August as well. ZIL suddenly climbed from $0.0176 to $0.0264, before dropping to $0.0137 over the next month.
Going by the same pattern, we can assume that ZIL/USD is going to jump till the $0.02375 resistance line before it goes through another month-long decline. So, $0.02375 is the level where traders would likely want to cash out.
ZIL/USD hourly chart
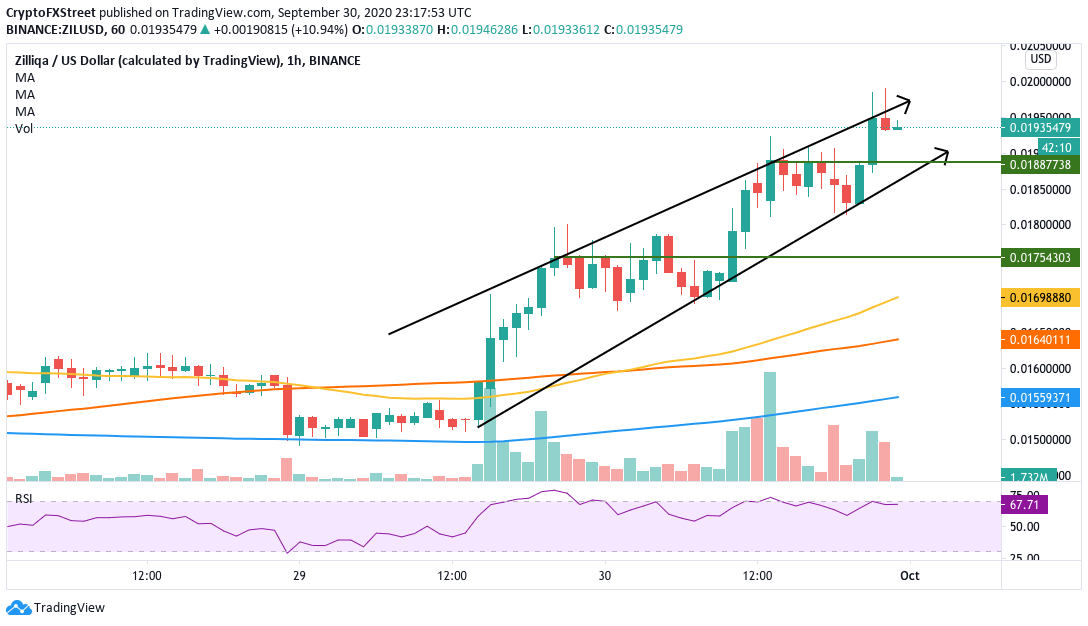
The hourly chart has charted the rising wedge pattern. Wedge patterns tend to break in the opposite direction from the trend lines. Hence, a rising wedge indicates that the price will likely have a bearish breakout from the lower trending line. The RSI is also hovering along the edge of the overbought zone. Any bullish action in this time frame will likely tip it over and open the doors for the sellers.
So, ZIL may face a short term bearish correction on its path to hitting the $0.02375 resistance line.
Apart from Zilliqa, here is a handy report that will show you how the rest of the cryptocurrency market is performing.
If you want to know more about the KuCoin hack, then check this out.
Author

Rajarshi Mitra
Independent Analyst
Rajarshi entered the blockchain space in 2016. He is a blockchain researcher who has worked for Blockgeeks and has done research work for several ICOs. He gets regularly invited to give talks on the blockchain technology and cryptocurrencies.


