Zilliqa Price Prediction: ZIL could be on the verge of a massive 600% breakout
- ZIL is currently trading at $0.0181 inside what seems to be a massive bull flag.
- A positive breakout above this pattern has the potential to drive Zilliqa up to $0.20.

Zilliqa had quite a crazy 2020 starting in January at a price of $0.0045 and crashing down to $0.003 in March. However, ZIL’s recovery was one of the best going from that low to a peak of $0.0258 only a few months later and reaching a $270 million market capitalization.
ZIL bulls could be eying up a colossal 600% breakout
A significant pattern has been developing on the 3-day chart. It seems that a huge bull flag was established by the bulls after an initial 630% price explosion on April 18. The price of ZIL is currently trading sideways, seeking the bullish breakout of the flag.
ZIL/USD 3-day chart
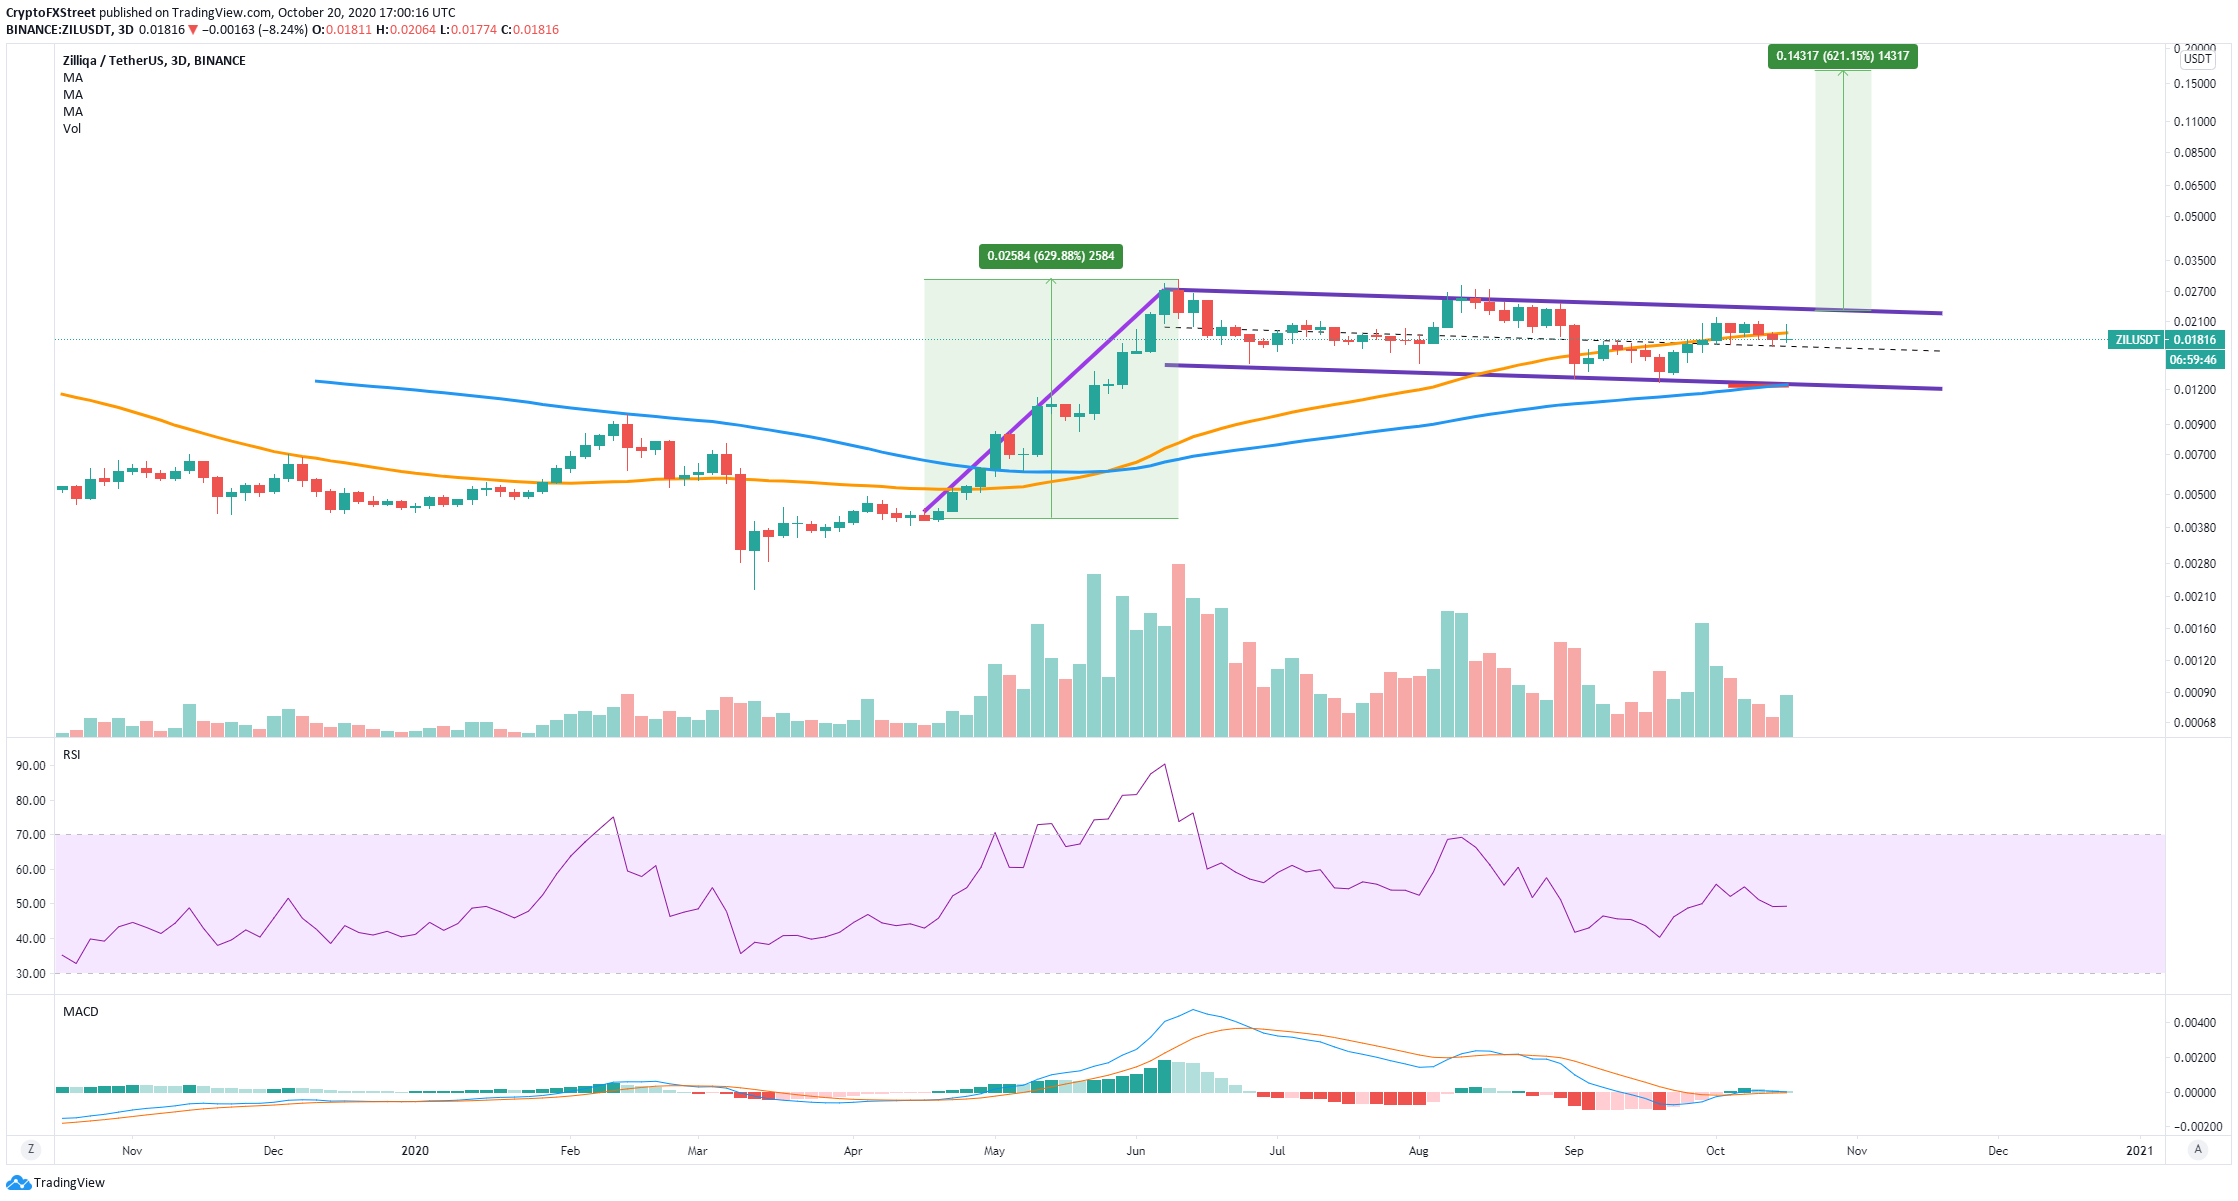
ZIL is currently fighting to stay above the 50-SMA after turning the MACD bullish on October 6. We know a breakout above the upper trendline at $0.023 can push the price of Zilliqa by up to 600% since this percentage is equal to the flag pole.
ZIL/USD daily chart
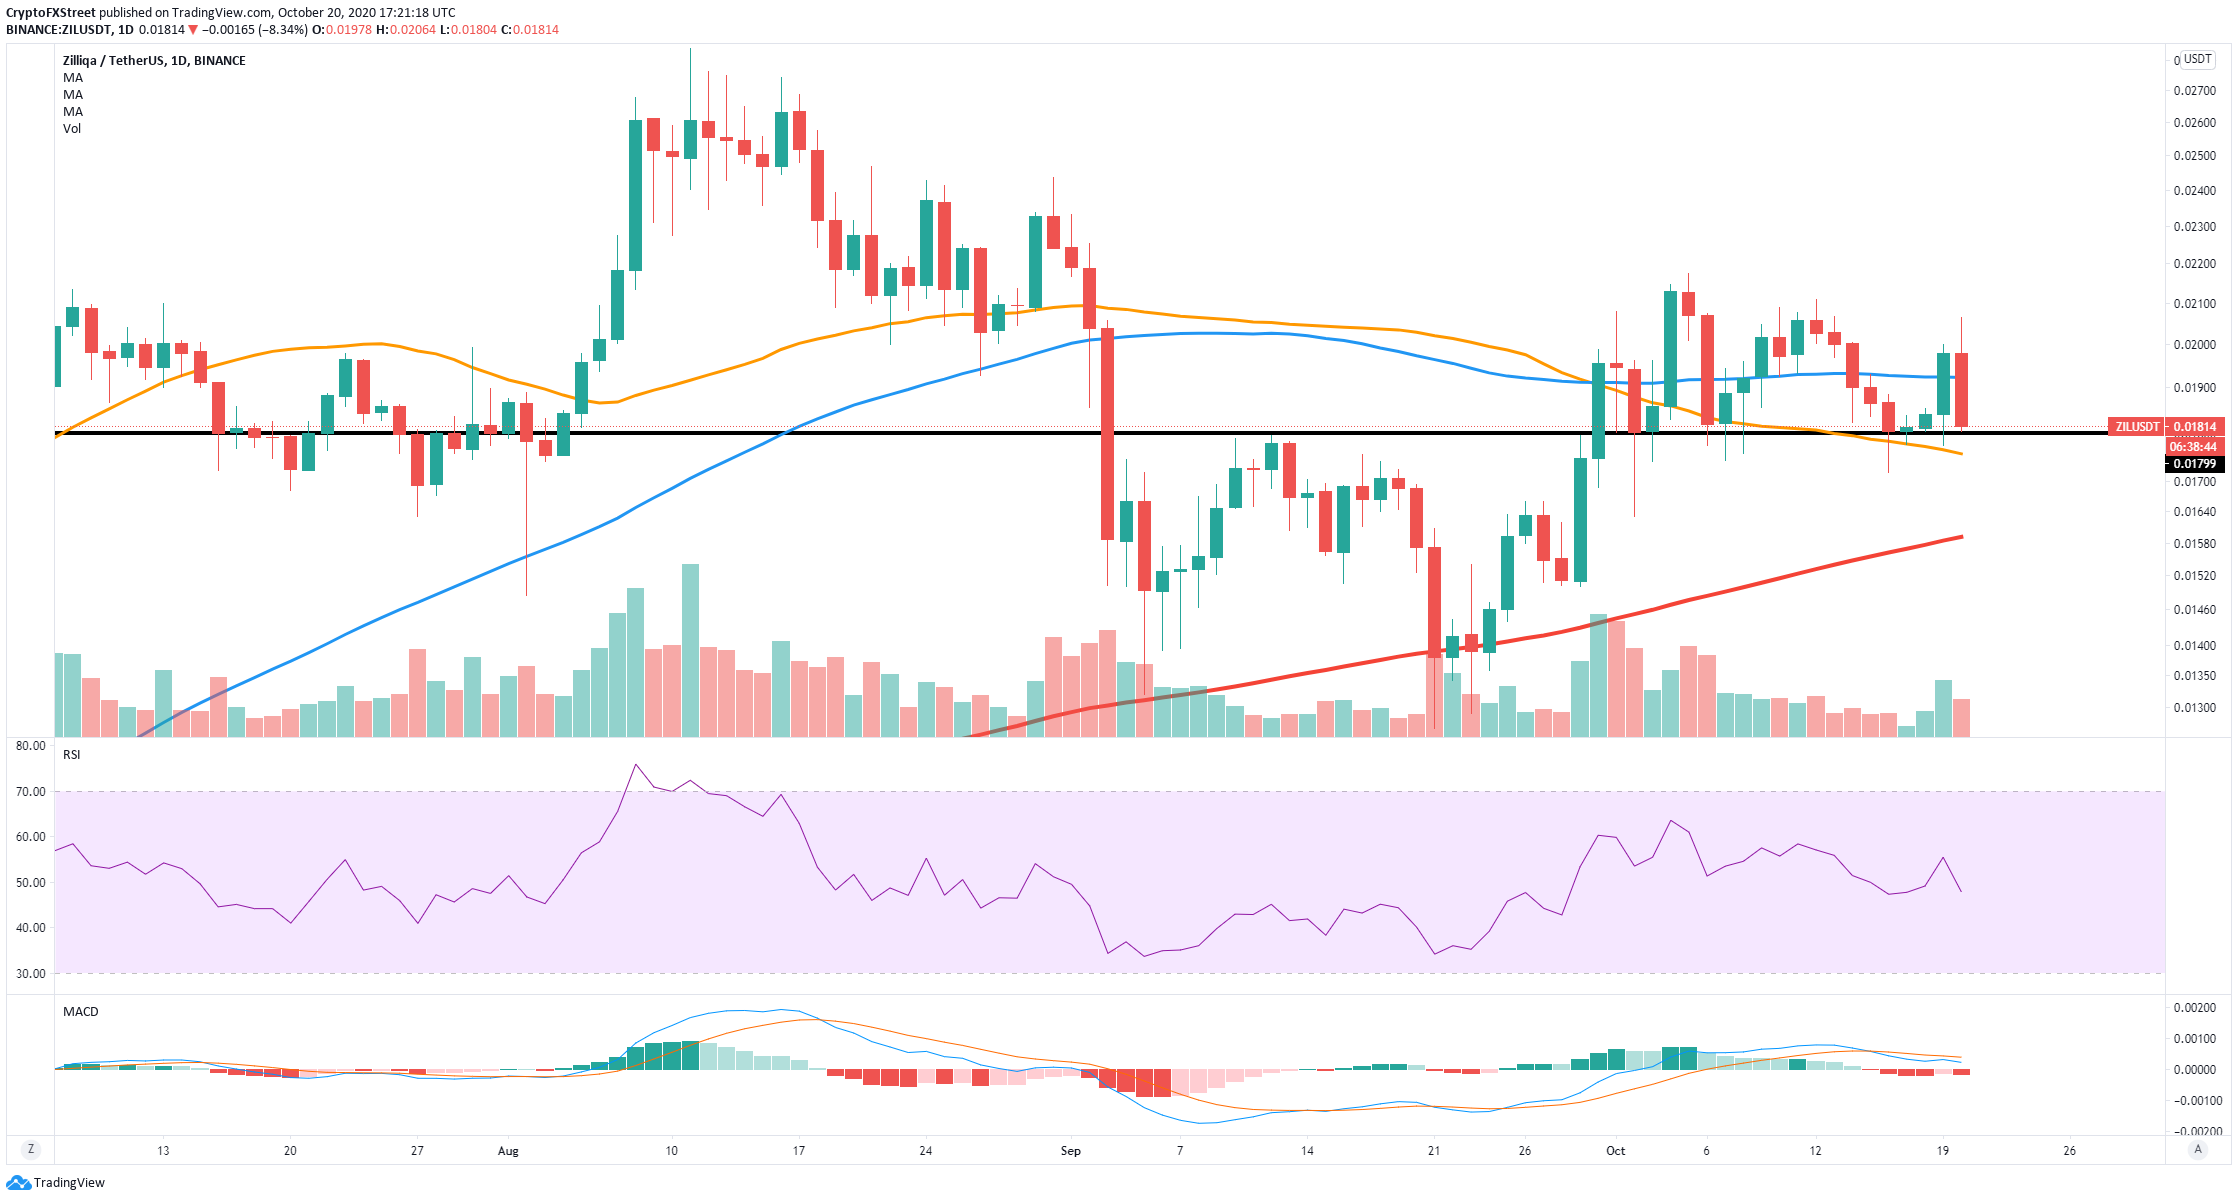
On the daily chart, the bulls have been in control for the most part. ZIL is still trading above the 50-SMA and the 200-SMA and fighting to stay over the 100-SMA. The digital asset established a robust support level at $0.0179 which almost coincides with the 50-SMA.
ZIL/USD 1-hour chart
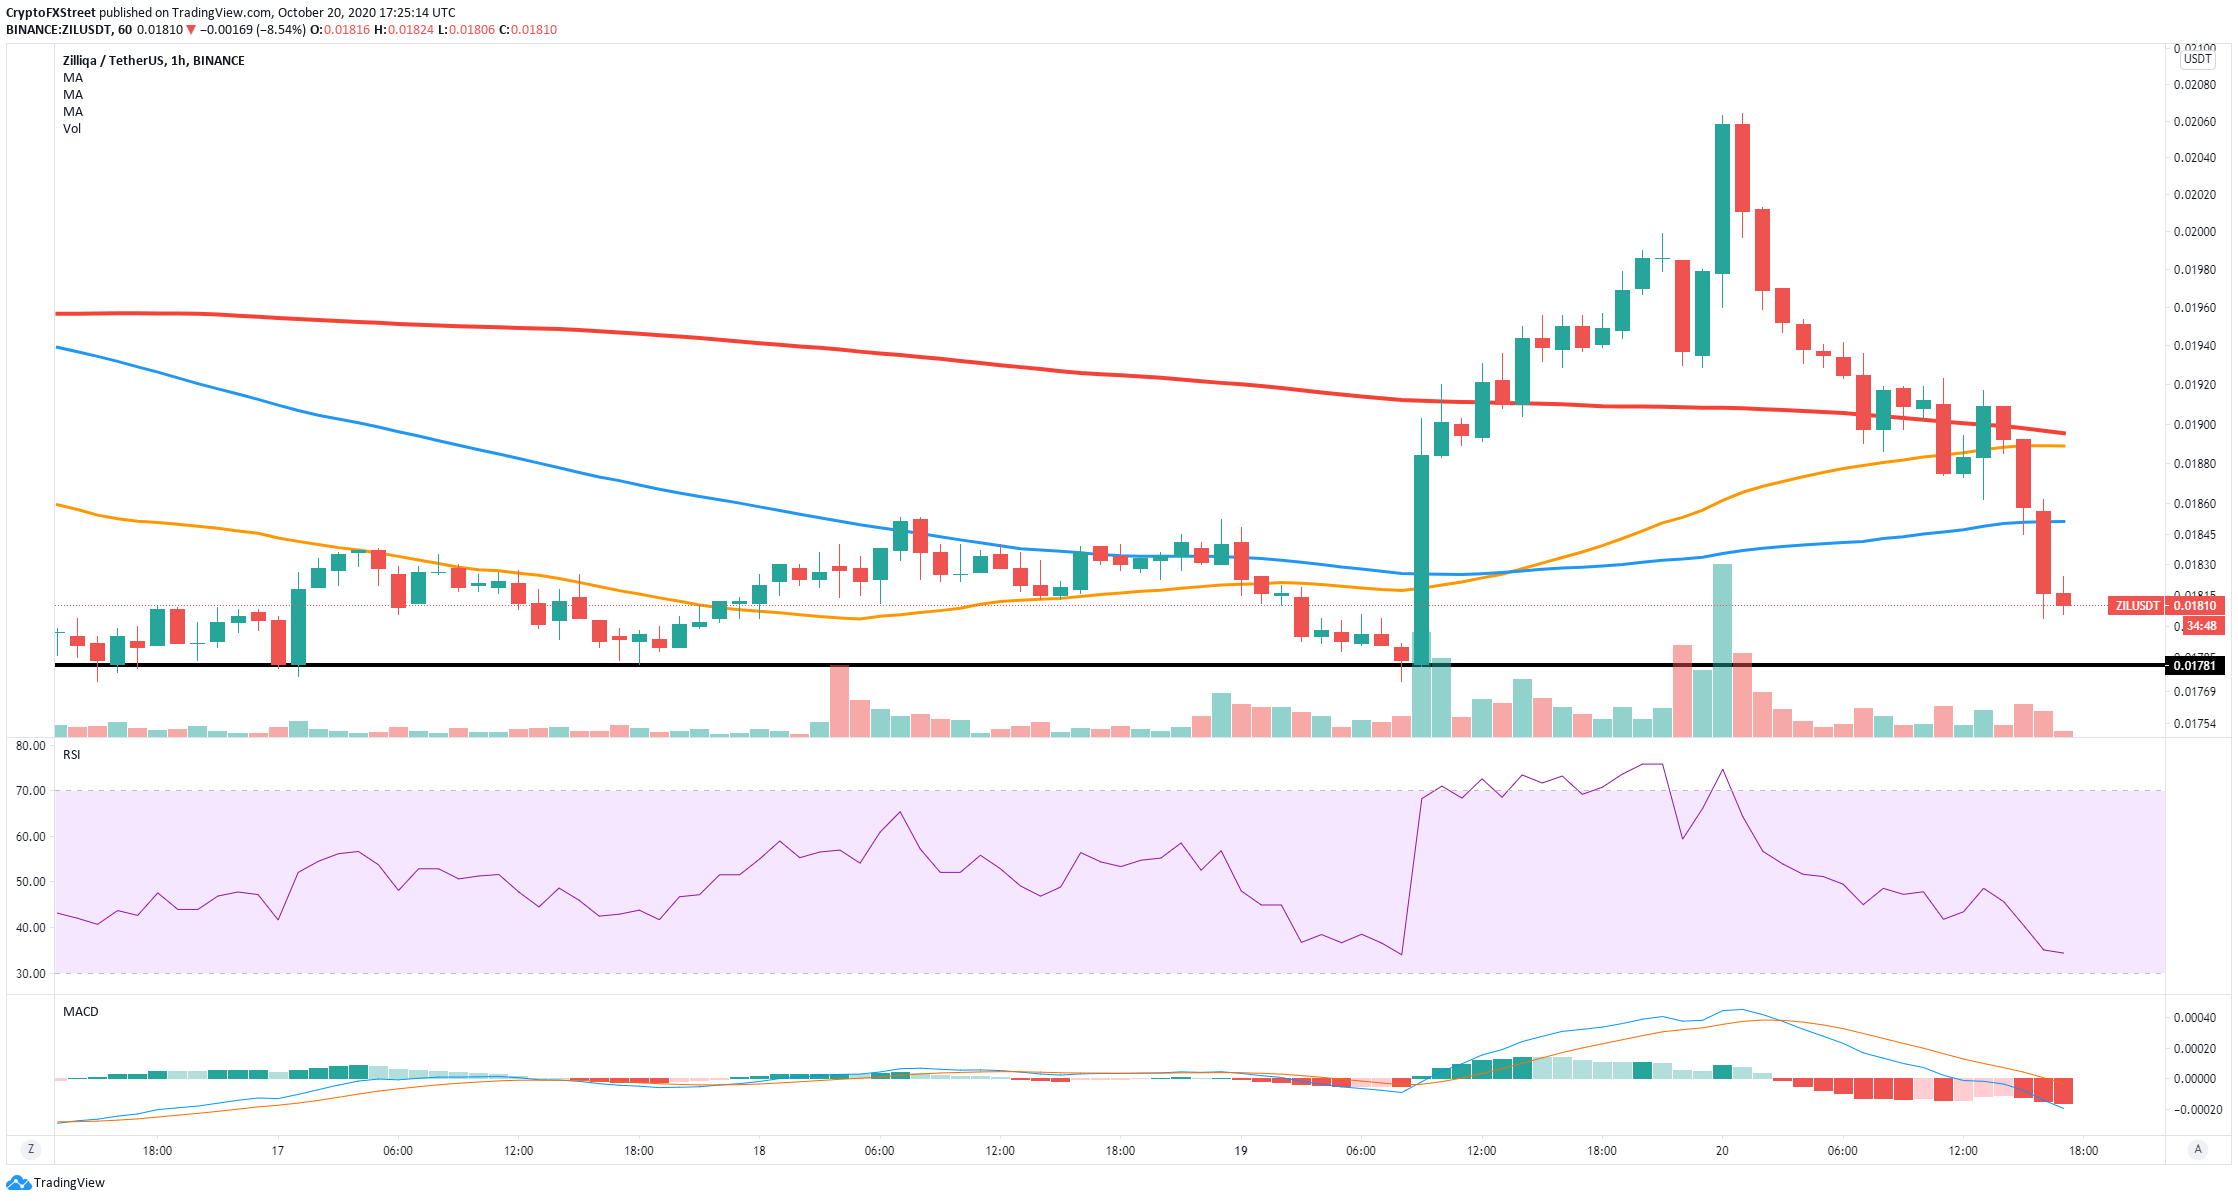
On the other hand, it seems that the short-term is in favor of the bears. On the hourly chart, the price of ZIL has slipped below the 50-SMA, 100-SMA, and 200-SMA, turning all three into resistance levels on the way up.
Additionally, the MACD turned bearish around 15 hours ago and it’s gaining strength. The next support level is located at $0.0178, a breakout below this point can easily send ZIL towards the low of $0.0171 and potentially lower in the longer-term.
Crucial price points for bulls and bears
Bulls are paying close attention to the bull flag formed on the 3-day chart. A breakout above the upper trendline of the pattern can have an explosive effect over ZIL pushing the digital asset by around 600% in the long-term, towards $0.20.
On the other hand, it seems that for now, the short-term is in favor of the bears which are eying up a breakout below a crucial support level at $0.0178. Failure to hold this level can drive ZIL down to $0.0171 and perhaps even lower in the longer-term.
Author

Lorenzo Stroe
Independent Analyst
Lorenzo is an experienced Technical Analyst and Content Writer who has been working in the cryptocurrency industry since 2012. He also has a passion for trading.


