XRP price still undecided, as bearish Ripple technical signals accumulate
- XRP price triggers a death cross signal on the 12-hour chart.
- Ripple supported by the neckline of a multi-year inverse head-and-shoulders pattern.
- Bear flag pattern remains live after producing a sell signal on June 3.

XRP price following the bear flag sell signal on June 3 has trended lower, but without the impulsiveness often characteristic of such patterns. It does not confirm that the signal was false but reflects the explicit support offered by the neckline of a multi-year inverse head-and-shoulders pattern triggered in April. For now, the international settlements token appears range-bound between $0.76 and $1.00.
XRP price encourages patience and precise trade entries
Beginning after the May 23 low at the 200-day simple moving average (SMA), Ripple has defended a critical price range framed by the November 2020 high at $0.780 and the neckline of a multi-year inverse head-and-shoulders pattern at $0.760.
As first described in a June 11 FXStreet article, the neckline runs from the September 2018 high of $0.791 through the November 2020 high of $0.780. The XRP price pattern was launched on April 5 when an explosive one-day gain of 44%. Since that time, the neckline combined with the November 2020 high has offered dominant support to short-term declines.
On the upside, the price range between the psychologically important $1 and the 38.2% Fibonacci retracement of the April-May correction at $1.145 has contained the rebounds since May 23, thus forming a convenient and actionable trading range for keen Ripple swing traders.
Considering the new death cross signal on the twelve-hour chart coupled with intimidating resistance defined by the convergence of the 200 twelve-hour moving average at $1.013 with the structurally important $1, XRP price bounces may be limited.
Within the context of the more prominent bear flag pattern, the sideways price action may merely be a corrective process before the resumption of the decline. Nevertheless, a daily close below $0.760 should dictate a rethink of the neutral outlook in favor of a more bearish outlook that includes at least a sweep of the May 23 low of $0.652.
The measured move of the bear flag pattern, determined by the percentage length of the flagpole, is approximately 55%, establishing $0.422 as the target. Thus, at $0.422, XRP price will have declined almost 80% from the April high of $1.96, thereby cancelling the ambitious forecasts of a test of the all-time high of $3.30 in 2021.
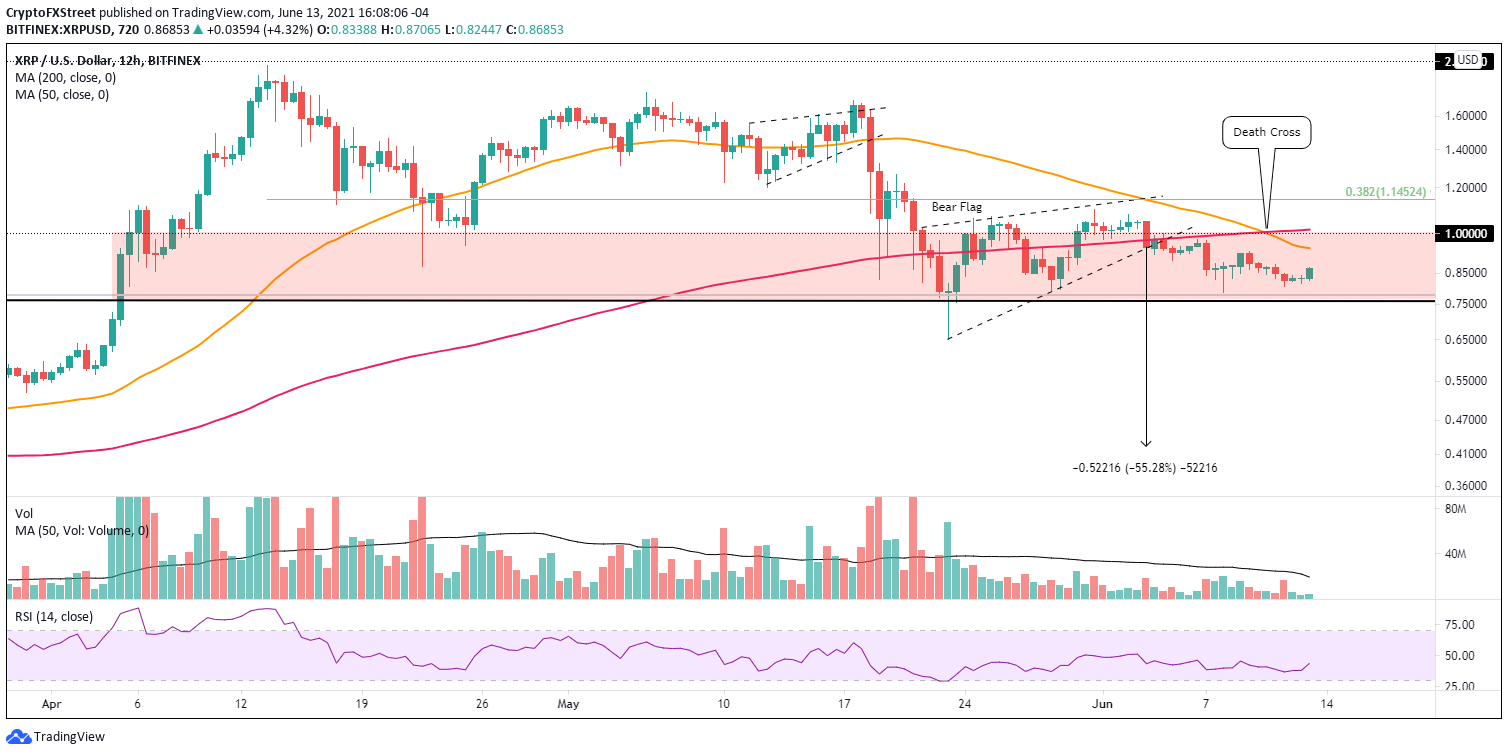
XRP/USD 12-hour chart
On the upside, XRP price would need to begin with a daily close above $1 and the 200 twelve-hour SMA at $1.013 before engaging a bullish outlook. A bullish view would be confirmed by a daily close above the 38.2% retracement at $1.145. It would be approximately 35% gain from the current price, but investors should be patient without entries near definitive support.
Like most altcoins, XRP price action may have rewarded the short-term traders, but it has not clarified the forecast for Ripple. As a result, investors need either the support or resistance levels mentioned earlier in the post to break to better view the digital asset’s intentions. Until that time, it is practical to trade the ranges with one eye on the bigger picture that currently includes a triggered bear flag pattern and a death cross on the twelve-hour chart.
Author

Sheldon McIntyre, CMT
Independent Analyst
Sheldon has 24 years of investment experience holding various positions in companies based in the United States and Chile. His core competencies include BRIC and G-10 equity markets, swing and position trading and technical analysis.


