XRP Price Prediction: Ripple bulls respite to end with blast off to $0.98
- XRP price continues to bleed as investors start to cash out profits in the recent upswing.
- Ripple is likely to bounce from the 50% Fibonacci retracement level at $0.877 or the swing low at $0.831.
- A breakdown of the 79% Fibonacci retracement level at $0.746 will invalidate the upswing and kick-start a potential downswing.

XRP price saw a healthy run-up after bleeding excessively over the past three weeks. Investors seem to be booking profits, which has stifled the recent run-up. If this continues, Ripple could bounce off two crucial support levels and restart its uptrend.
XRP price remains bullish
XRP price dropped 28% over the past week and rallied roughly 18% since June 8. Although the bulls weren’t done pushing Ripple to a swing high, eager investors seem to have started booking profits, reversing the rally.
While it is unclear if this trend will continue, investors need to pay close attention to the immediate support level at $0.877, coinciding with the 50% Fibonacci retracement level. This area has been a significant barrier, so a bounce here seems likely.
In case of a breakdown of this barrier, XRP price will slide 5% to test the support level at $0.831, another worthy contender for reversing this retracement.
Assuming the buyers swoop in to rescue the remittance token here, XRP price will first reclaim the 50% Fibonacci retracement level at $0.877, followed by a retest of the recent swing high at $0.93.
However, the ultimate test of bulls’ strength will occur at $0.969 or the supply zone’s lower trend line at $0.979.
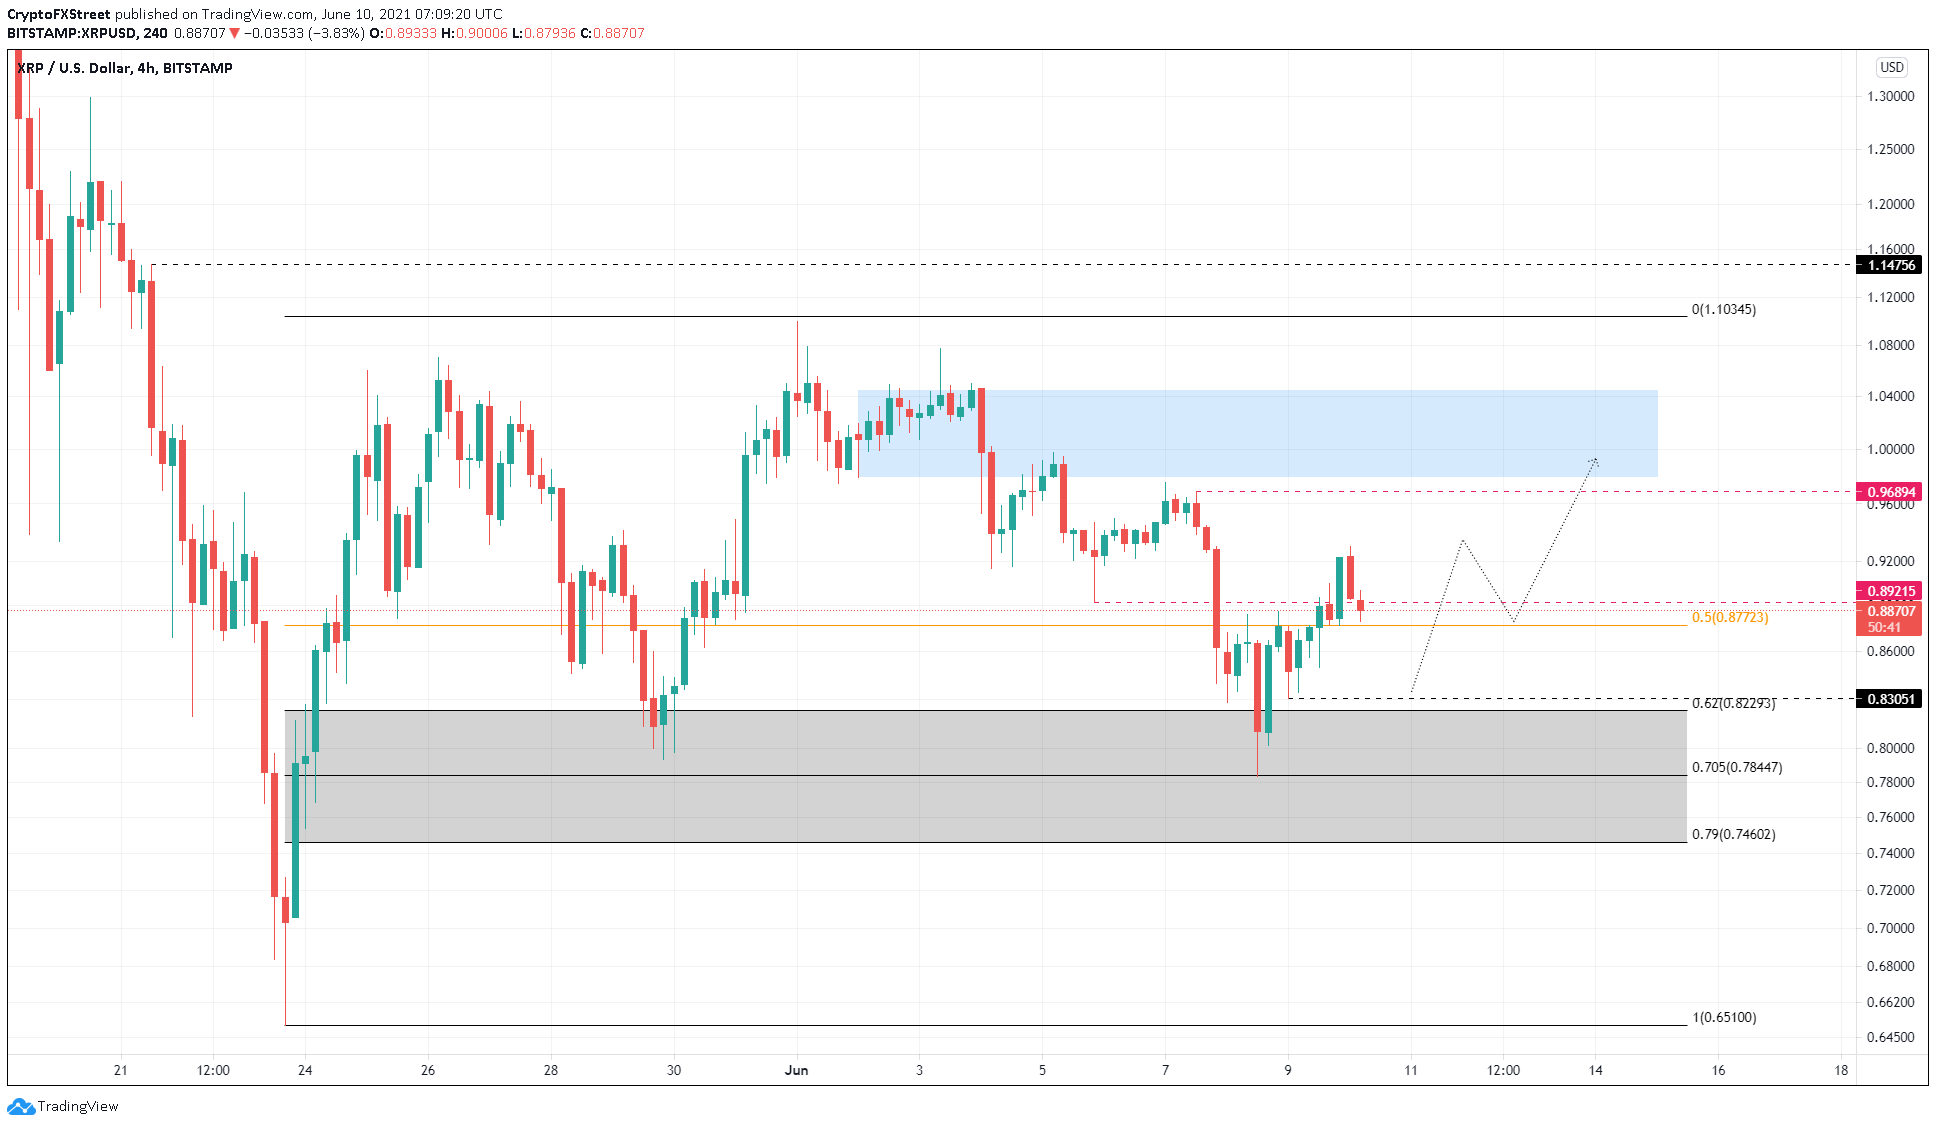
XRP/USDT 4-hour chart
Supporting this bullish outlook is the 30-day Market Value to Realized Value (MVRV) model, suggesting that XRP price is in an opportunity zone. This fundamental index measures the average profit/loss of investors that purchased XRP in the past month.
A negative value represents short-term traders booking profits, allowing the long-term investors to accumulate.
The last time the MVRV model dipped this low was on February 28, 2021. A week later, XRP price rallied 30% over the next month.
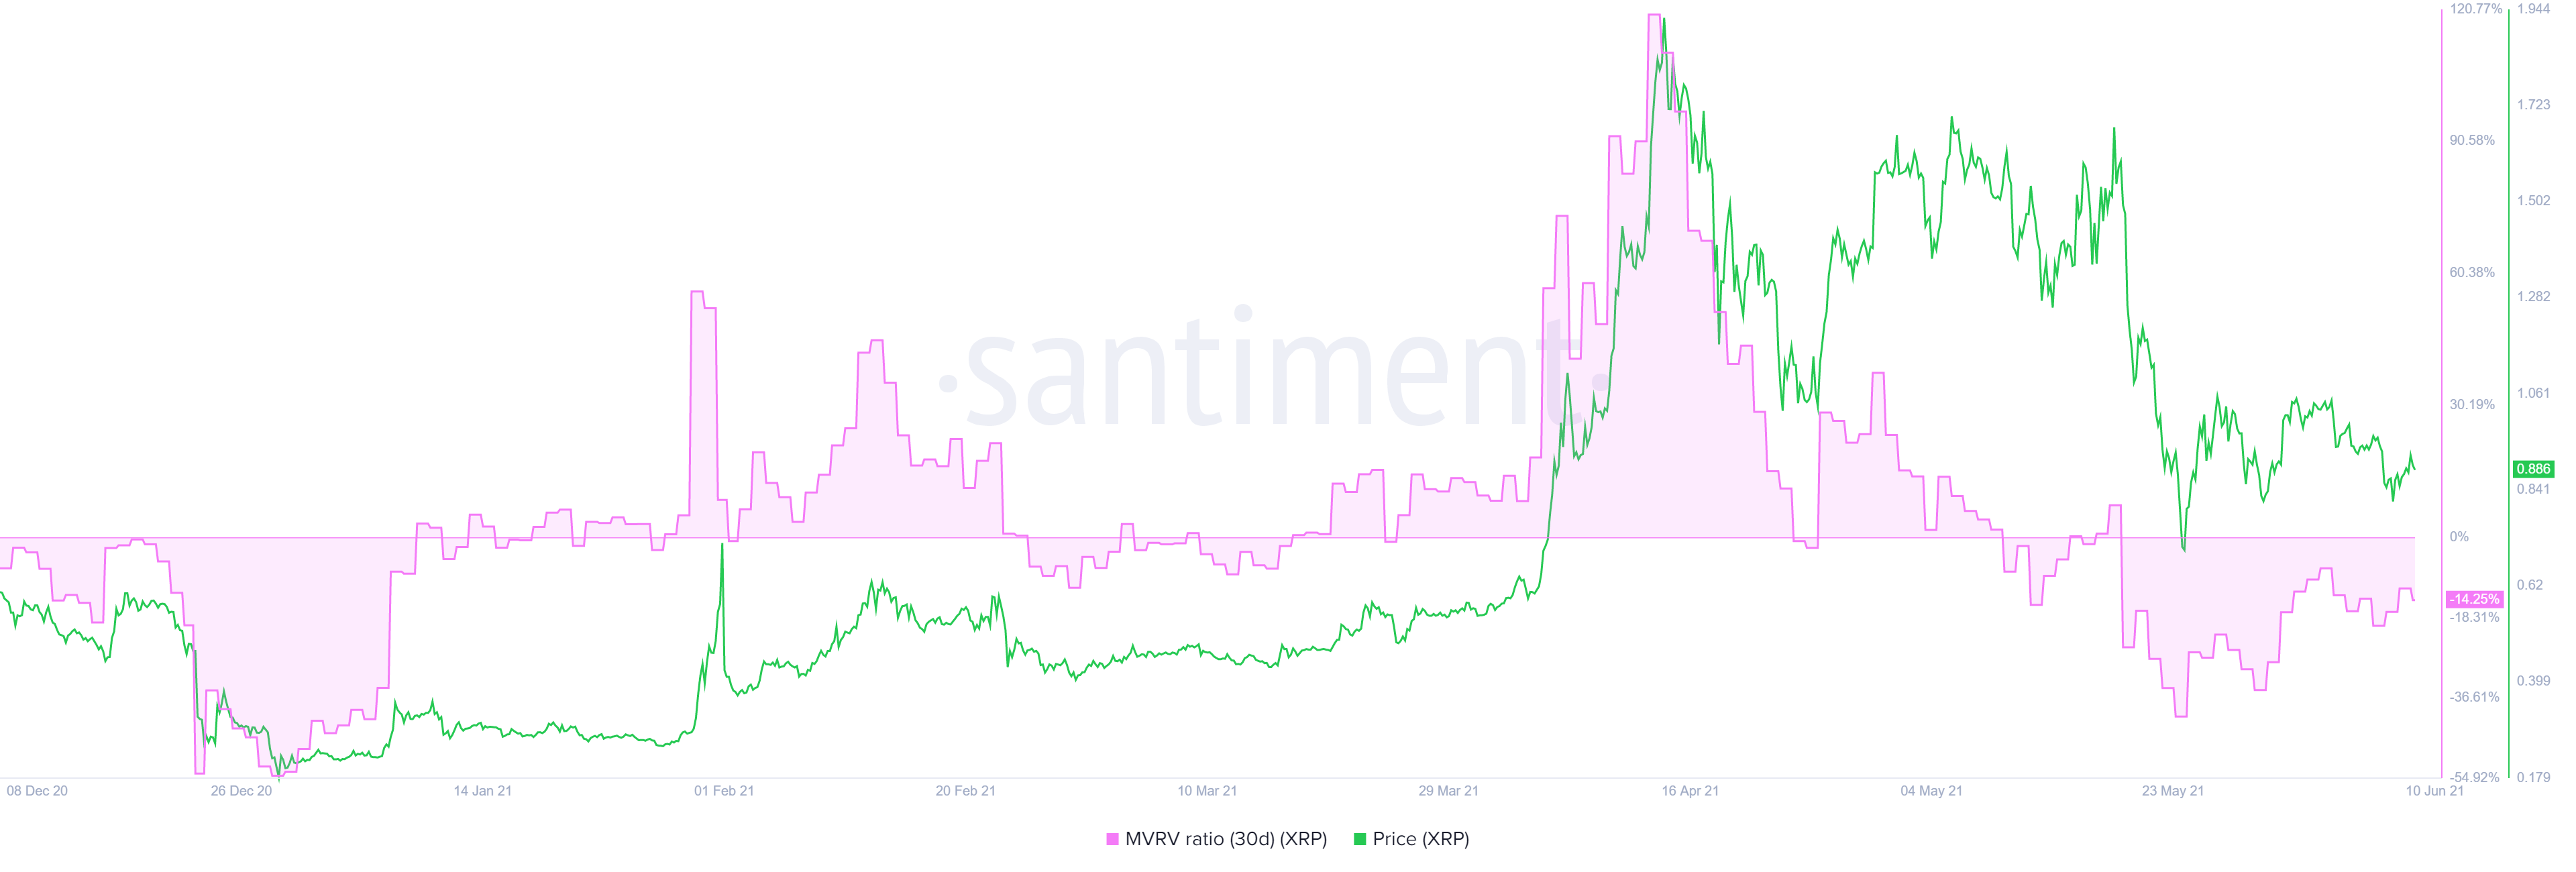
XRP 30-day MVRV chart
Moreover, the whale transactions worth $100,000 or more are below 200, indicating no potential tops being formed. Typically a spike in this metric coincides with local tops, which might reveal high net worth individuals cashing out their positions or reallocating their holdings.
Therefore, investors can expect XRP price to make a higher low and continue its ascent after a minor retracement.
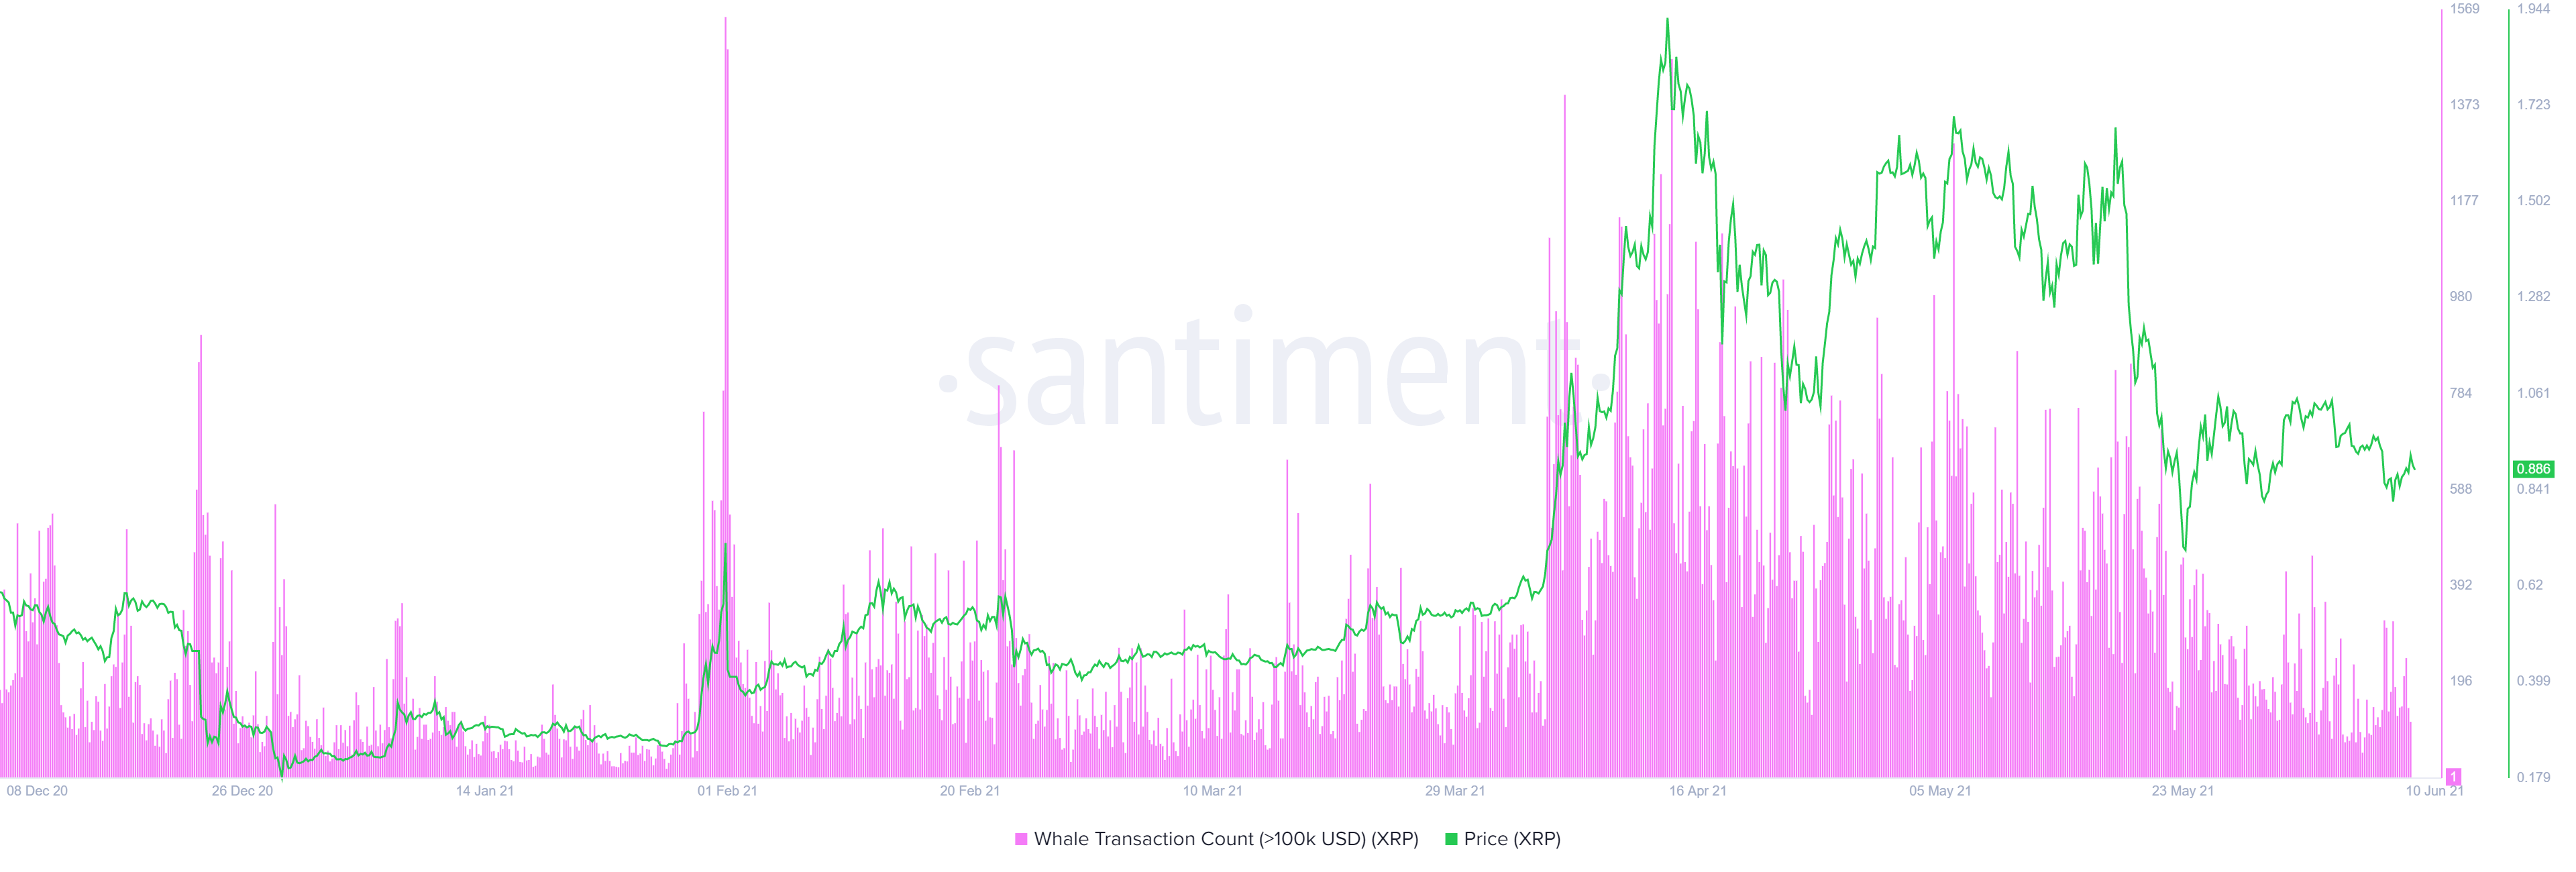
XRP large transaction chart
In certain situations, XRP price could slide to $0.823 or $0.784 while remaining bullish. These are high probability reversal zones and might retest the remittance token’s impulsive wave.
However, a decisive close below $0.746 will invalidate the bullish thesis and open up the possibility of a 12% sell-off to the range low at $0.651.
Author

Akash Girimath
FXStreet
Akash Girimath is a Mechanical Engineer interested in the chaos of the financial markets. Trying to make sense of this convoluted yet fascinating space, he switched his engineering job to become a crypto reporter and analyst.


