XRP Price Forecast: Ripple multi-timeframe analysis projects a test of $1
- XRP price triggers bullish hammer candlestick pattern on the daily chart, but follow-through interrupted by the heavy market.
- Price supported by the convergence of the neckline of a multi-year head-and-shoulders pattern with the November 2020 high.
- Ripple below-average volume indicates no mass exodus despite the dull price structure.

XRP price remains reluctant despite the bullish hammer trigger on the daily chart. For now, Ripple continues to be influenced by the broader cryptocurrency market vibrations than anything specific to the digital asset. As long as XRP price remains locked in a price range defined by the psychologically important $1 and $0.760, investors should target swing trade opportunities and keep one eye on the bigger picture.
XRP price enthusiasm nullified by the indifference in the crypto complex
Since the May 23 low at the 200-day simple moving average (SMA), Ripple has defended a critical price range. The level corresponds to the union of the November 2020 high at $0.780 with the neckline of a multi-year inverse head-and-shoulders pattern at $0.760.
The neckline runs from the September 2018 high of $0.791 through the November 2020 high of $0.780. The inverse head-and-shoulders pattern was triggered on April 5 with an explosive 44% gain. Since that time, the neckline has held on a weekly closing basis, as highlighted in the chart below. Moreover, the chart highlights how important $1 has been on a weekly closing basis over the last three weeks.
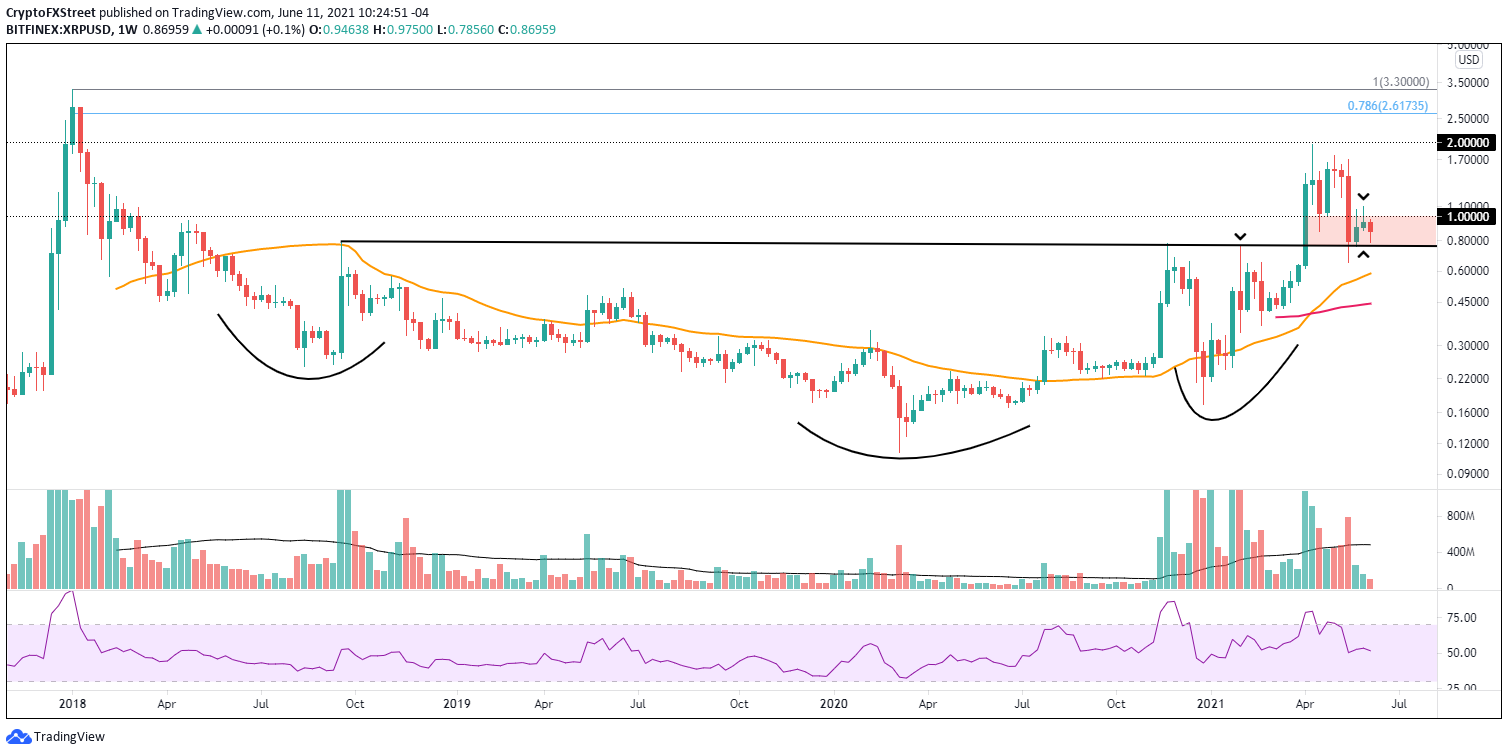
XRP/USD weekly chart
Today, the trigger of the bullish hammer candlestick pattern has not inspired XRP price to rally to the structurally significant $1. Still, the bias of the daily chart points to a renewal of the hammer breakout, representing a 15% gain from the current price.
As $1 is instructive for price action, a daily close above the level could stimulate XRP price to challenge the confluence of the 38.2% Fibonacci retracement of the April-May decline at $1.153 with the declining 50-day SMA at $1.205, yielding an approximate gain of 37% from the current price.
To generate a break out above $1, Ripple will need a renewal of commitment and emotion of investors in the cryptocurrency, or XRP price will be returned to the governing price range mentioned above.
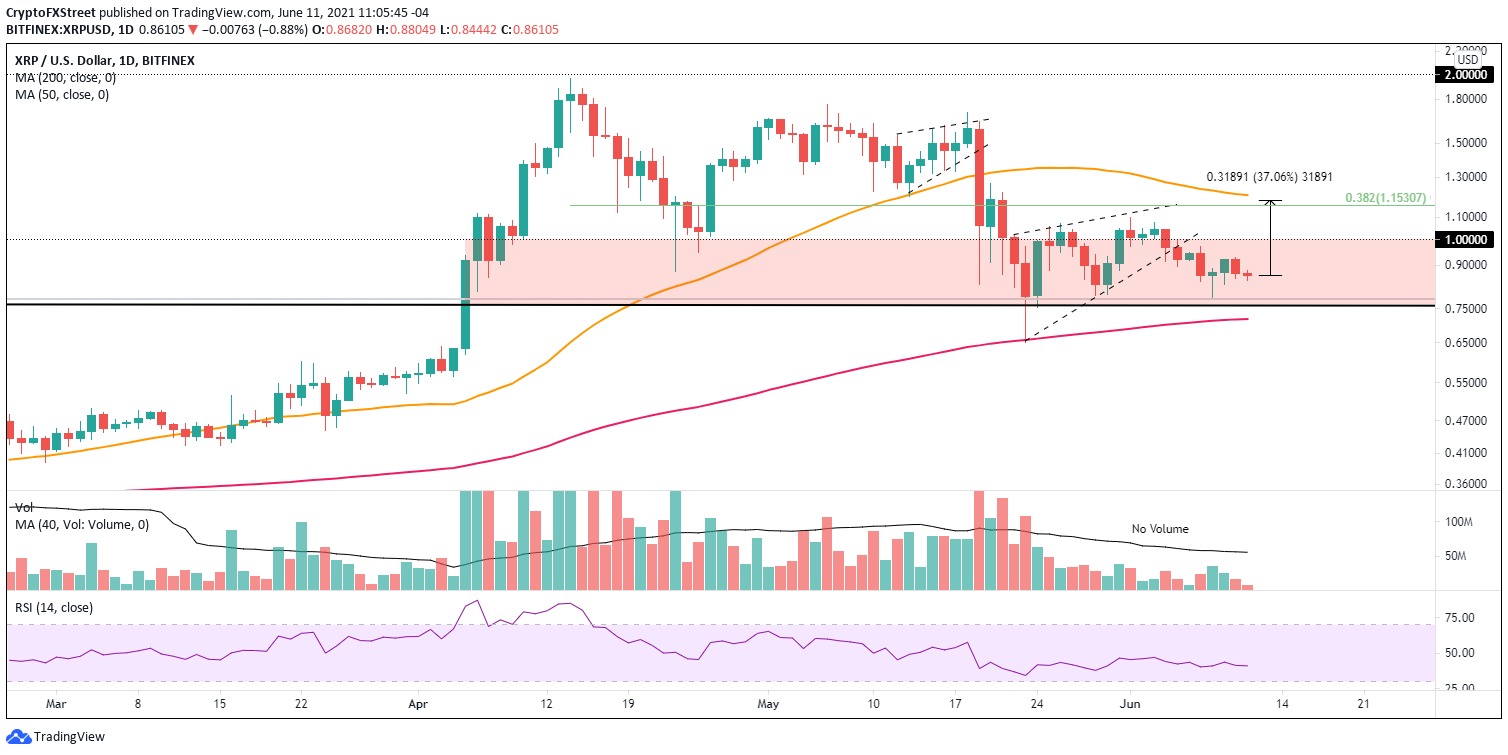
XRP/USD daily chart
A failure to hold the $0.760-$0.780 price range should be met with notable support at the 200-day SMA at $0.718. If the cryptocurrency complex suffers a new wave of selling, XRP could sweep below the May 23 low at $0.652. A close below the low would motivate a reevaluation of the longer-term outlook for Ripple and leave the international settlements token vulnerable to a test of the 40-week SMA at $0.588.
The dark cloud of the Ripple and SEC legal tussle is worth considering in any XRP price evaluation. Still, the bullish fundamental story is equally engaging, posing a shifting challenge for investors. Fortunately, the clarity of the price structure on two timeframes, with explicit support and resistance levels, affords a mechanical approach to seizing trading opportunities or extending trade durations instead of relying on subjective conclusions on the principal fundamental developments.
Author

Sheldon McIntyre, CMT
Independent Analyst
Sheldon has 24 years of investment experience holding various positions in companies based in the United States and Chile. His core competencies include BRIC and G-10 equity markets, swing and position trading and technical analysis.


