XLM price still looks bearish, Stellar might break below $0.20
- XLM price is finally catching a breath after the correction from the past few days.
- Upside is limited with a few technical resistances that can easily push price-action back down.
- Stellar can retest $0.20 and could break lower in a bull trap.

XLM price is not shooting for the stars these past few days. And technically, the Stellar story is not that bright either, with a break below $0.20 possible in the coming days.
XLM price is caught in a bull trap
On a daily chart, XLM price sees a very nice recovery from the bounce of $0.20. Before you consider going long Stellar, it is time to have a look under the hood, and that is not a very compelling story.
Although XLM price action might be recovering, it had a substantial break to the downside of the 0 Fibonacci level. Stellar does not look like the recovery will get back up there today, which makes that level a heavy resistance area to the upside.
Next to that, XLM has a very well-respected downward trendline, which has been tested five times already but could not break to the upside. The 55 DMA is also spot on with the trendline, add to the other factors and you have three reasons for resistance and a rejection of price action.
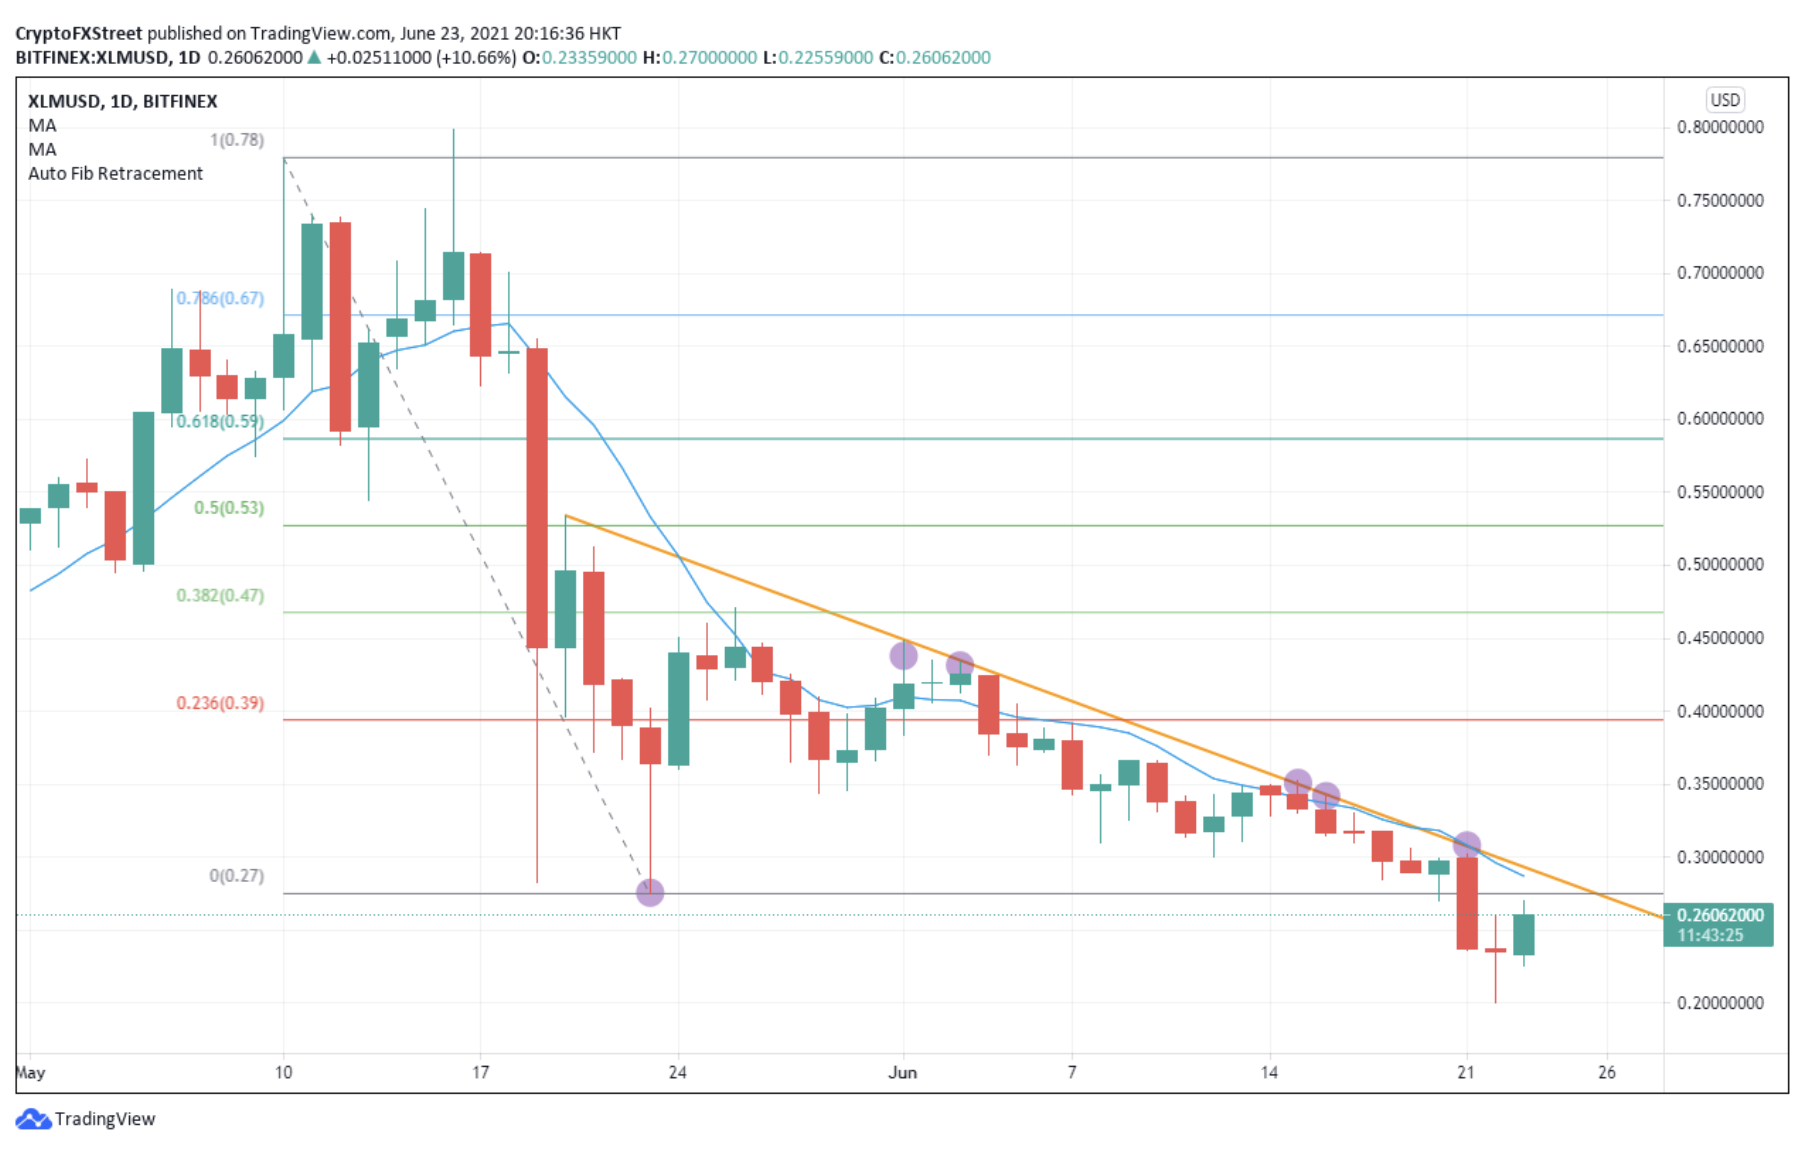
XLM/USD daily chart
XLM price can go a little bit higher, but if we do not get a daily close above the $0.27 level, this is potentially a bull trap and Stellar could dip lower towards $0.20 for the retest and break lower.
If XLM price does get a daily close above, a clear break of the trendline is a further reason to buy Stellar.
Author
FXStreet Team
FXStreet
Composed of a group of economic journalists and FX experts, the FXStreet content team produces and oversees all content published on FXStreet. It provides a purely journalistic approach to the Forex market.


