XLM price shows strength above $0.36, releasing Stellar for a 30% rally
- XLM price forms a bullish hammer candlestick pattern on the daily chart.
- Stellar rests below the strategically important 200-day simple moving average (SMA).
- 61.8% Fibonacci retracement of the March 2020-May 2021 rally providing support during this pullback.

XLM price struck support at the 61.8% retracement level yesterday before rebounding to close positive on a day that initially looked bearish for the cryptocurrency complex. Until Stellar can close above yesterday’s bullish hammer candlestick pattern, the outlook is neutral.
XLM price quietly drifts lower after channel rejection
The May 19 and 23 XLM price plunges dismantled the 50-day SMA, the channel’s lower trend line support, thereby evacuating the weak holders and prominent pockets of anxiety. The digital asset’s response to the remarkable declines was an almost 80% rally from the May 19 low to the May 20 high and a 70% rebound from the May 23 low to the May 26 high.
From May 20 until May 30, XLM price structured a symmetrical triangle that briefly resolved to the upside on May 31 before striking the channel’s lower trend line resistance and slipping in a tight consolidation for two days. Since June 4, Stellar has declined around 25%, but the drop is not characterized by a stampede to the exits. Volume has remained emphatically low, nowhere near the 50-day average.
Yesterday’s rebound and close with a hammer candlestick materialized from the 61.8% retracement of the 2020-2021 advance at $0.320 and slightly above the May 19 low at $0.300.
A daily close above yesterday’s high of $0.356 will trigger the hammer candlestick and free XLM price to immediately test the 200-day SMA at $0.375. If Stellar closes above the June 7 high at $0.392, investors could incrementally add to their original pilot position from the hammer trigger.
XLM price will not commence a far-reaching rally until it liquidates the channel’s lower trend line, currently at $0.462 and the 50-day SMA at $0.497. A Stellar rally to the channel’s lower trend line would constitute a 30% from yesterday’s hammer high.
Stellar Fibonacci levels at $0.536 and $0.597 may temporarily diminish the strength of the rally.
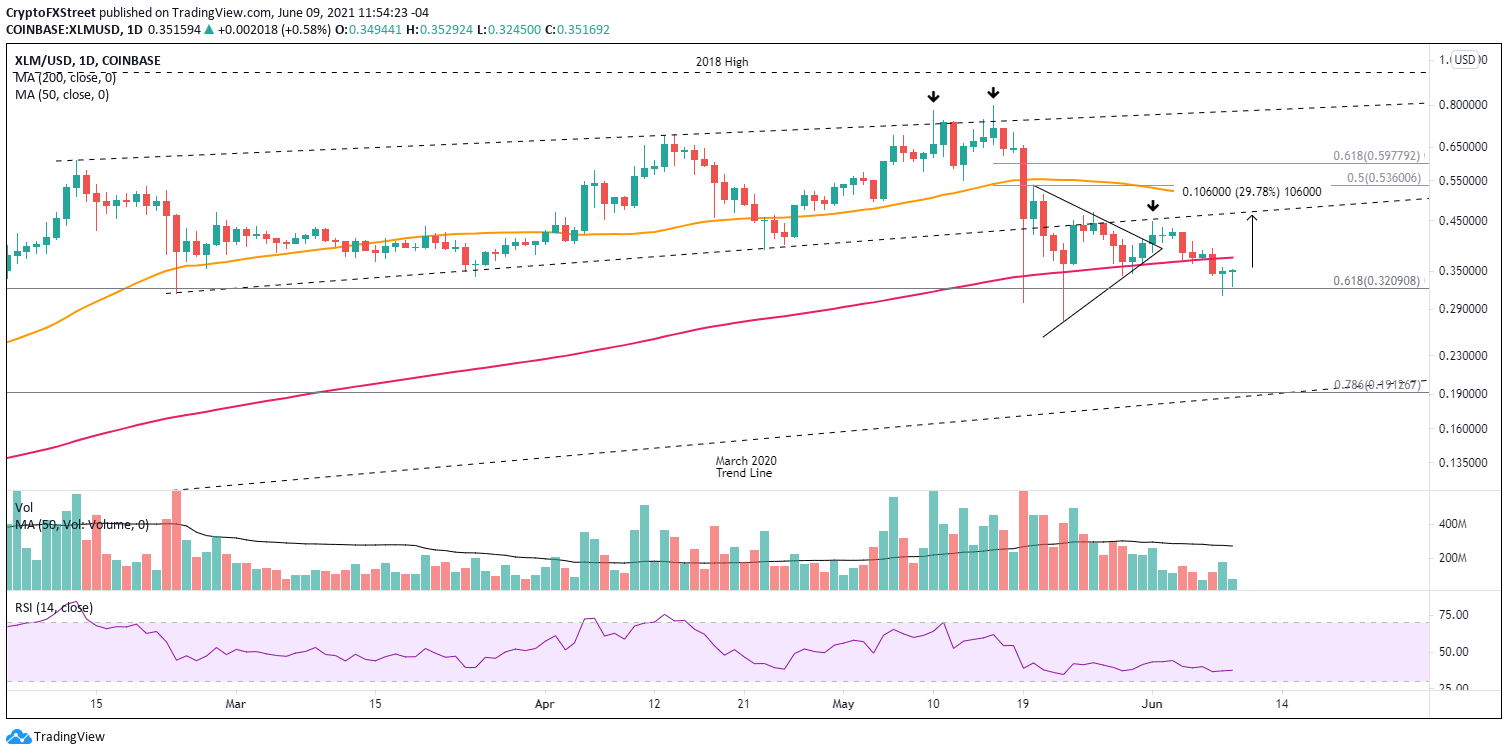
XLM/USD daily chart
If XLM price fails to trigger the hammer high, Stellar may decline to the May 23 low at $0.274. However, the inherent support composed by the May 19 low, May 23 low and the 61.8% retracement offers conclusive support for any further Stellar weakness.
Of course, a new tidal wave of sustained selling could strike the cryptocurrency market, which may jeopardize the support and leave XLM price exposed to a test of the 2020 rising trend line at $0.186, equalling a 45% drop from the current price.
Stellar rests at a short-term pivotal price level. Still, with a formidable support layer just below, XLM price is well-positioned to withstand any further residual selling that may emerge moving forward, creating a solid opportunity if the token does close above $0.356.
Author

Sheldon McIntyre, CMT
Independent Analyst
Sheldon has 24 years of investment experience holding various positions in companies based in the United States and Chile. His core competencies include BRIC and G-10 equity markets, swing and position trading and technical analysis.


