XLM Price Prediction: Stellar could sprint to $0.65 if crucial technical pattern confirms
- Stellar is consolidating between the 200 SMA and the 100 SMA.
- An ascending triangle breakout could lift XLM by 35% to $0.65.
- The SupeeTrend indicator has a bearish impulse likely to delay the breakout.

Stellar stalled at $0.48 following the dip to $0.3. Sideways price action seems to have taken precedence, but XLM appears to be leaning to the bullish side. The cross-border token is also trading between two key levels that might determine its future. Meanwhile, Stellar is looking toward a 35% technical breakout, aiming for $0.65.
Stellar must break above crucial resistance for a technical breakout
XLM is trading at $0.42 while stuck between the 200 Simple Moving Average (SMA) support and the 100 SMA resistance on the 4-hour chart. Due to the seller congestion between these two key levels, Stellar seems to have settled for consolidation before a potential breakout.
The 4-hour chart brings to light the formation of an ascending triangle. The pattern confirms the consolidation that may culminate in a massive upswing in the same direction as the previous trend. Ascending triangles are drawn using two trendlines, a horizontal one connecting a series of equal peaks and another linking consecutive rising lows.
A breakout is expected as soon as the price slices through the horizontal resistance. Triangles also have precise breakout targets measured from the highest to the lowest points.
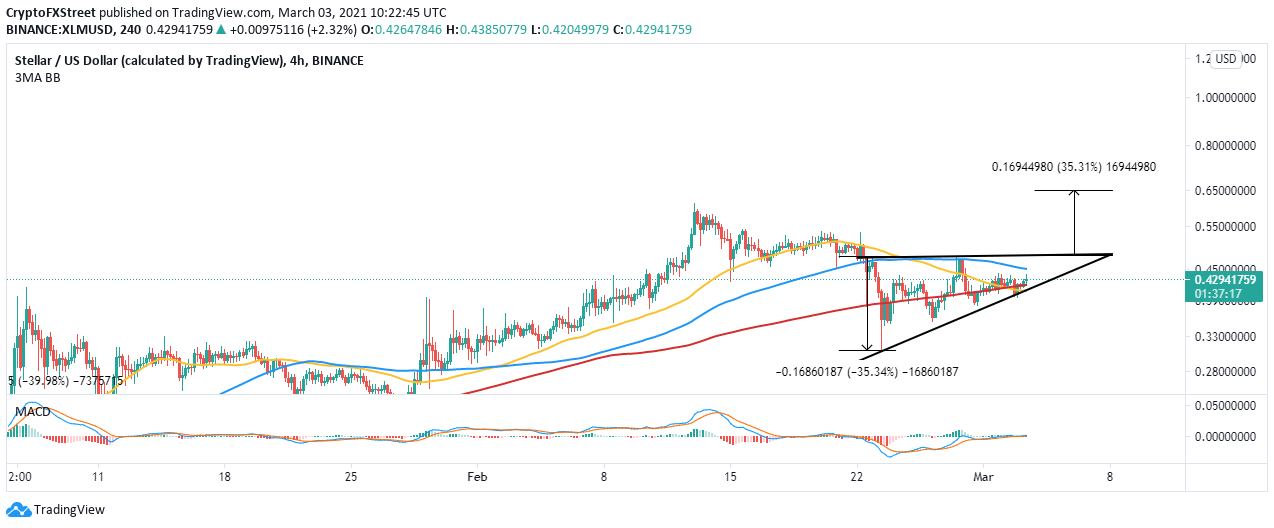
XLM/USD 4-hour chart
It is worth mentioning that XLM will continue with the sideways action based on the Moving Average Convergence Divergence. The indicator does not have a defined signal amid the leveling at the midline. However, bulls must look out for the MACD cross above the signal line, which may validate the uptrend.
Looking at the other side of the picture
The SuperTrend indicator on the same 4-hour chart shows that Stellar has a bearish impulse. It is a technical indicator traders use to predict long-term trends. Flipping red and rising above the price is a call to sell, while turning green and moving under the price reveals that we are in a bull market. Currently, the SuperTrend indicator shows that sellers still have the upper hand.
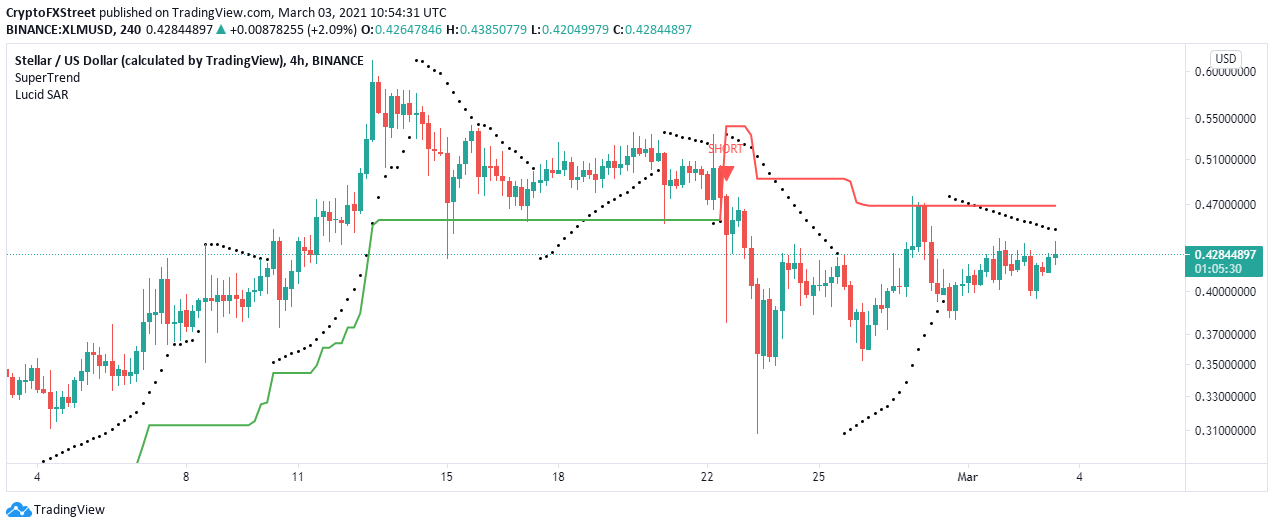
XLM/USD 4-hour chart
Similarly, the parabolic SAR points have also confirmed the bearish narrative. Stellar will liftoff significantly when the parabolas shift below the price. However, for now, the bearish influence is apparent and could continue to delay the breakout.
Author

John Isige
FXStreet
John Isige is a seasoned cryptocurrency journalist and markets analyst committed to delivering high-quality, actionable insights tailored to traders, investors, and crypto enthusiasts. He enjoys deep dives into emerging Web3 tren


