- A key indicator has presented a long-term sell signal for Stellar price.
- XLM must hold above a significant support level to avoid a massive 35% drop towards $0.27.
- Stellar doesn't have a lot of support on the way down.
Stellar had a massive 50% correction from a high of $0.606 on February 8 down to $0.311 on February 22. The digital asset seems to be poised for yet another leg down as technicals have turned against the bulls.
Stellar price will fall to $0.27 if it drops below this key level
On the weekly chart, the TD Sequential indicator has presented a sell signal. The most significant support level here is the 61.8% Fibonacci Retracement point at $0.40.
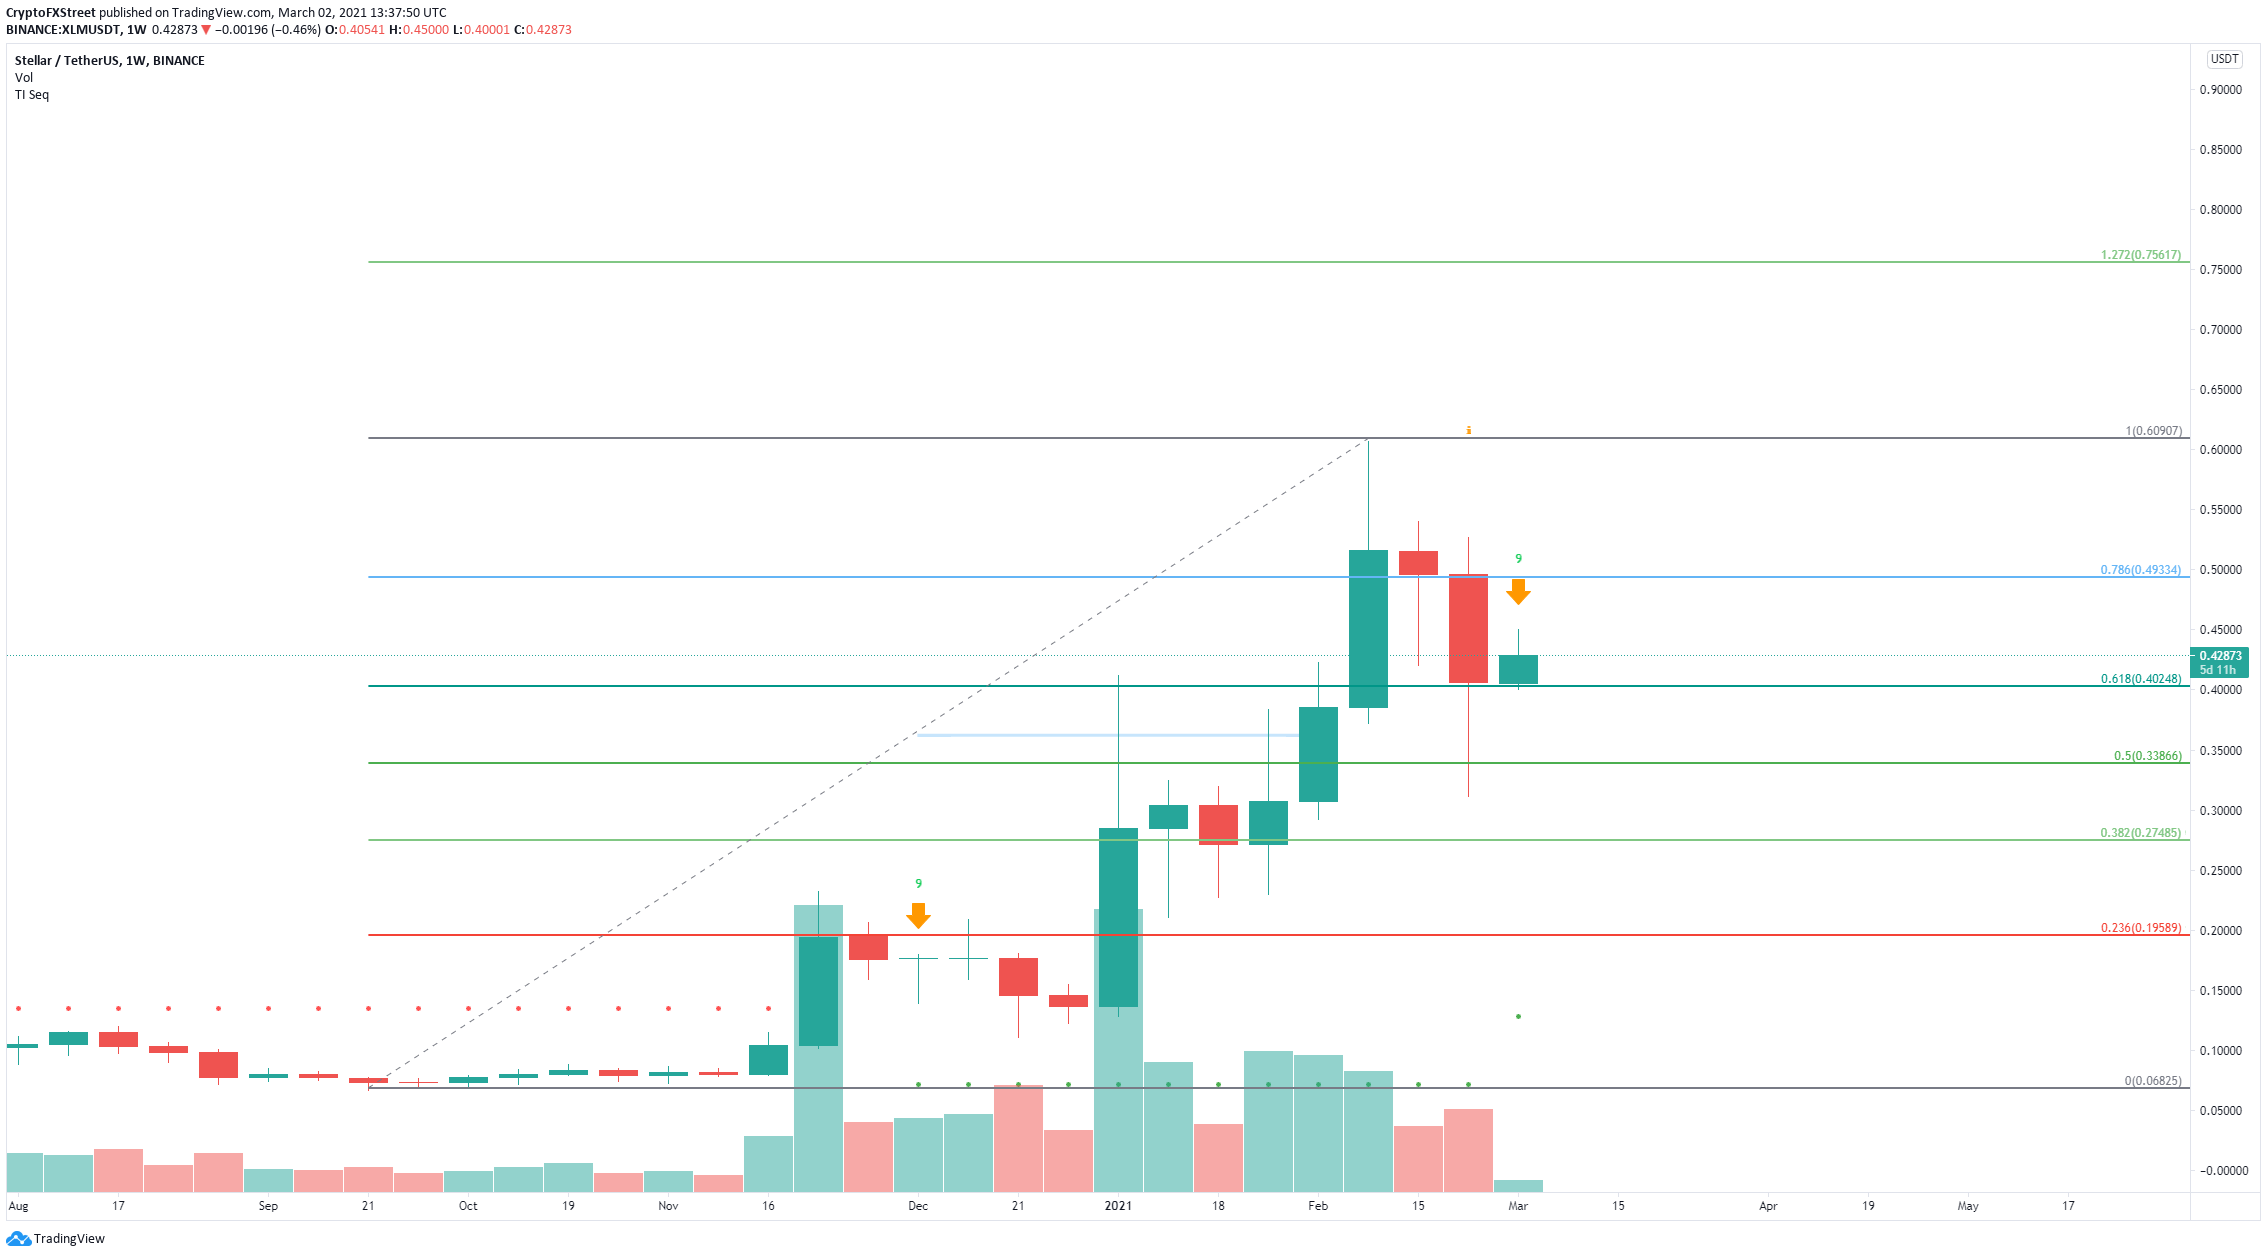
XLM/USD weekly chart
A breakdown below this key support level has the potential to push Stellar price down to $0.33, at the 50% Fibonacci level and as low as $0.27, at the 38.2% level. The last sell signal on December 2020 was confirmed and had a significant bearish continuation.
However, there is still hope for the bulls, which need to see a candlestick close above $0.49 to invalidate the bearish outlook. A breakout above this point could quickly drive Stellar price towards the high of $0.6.
Information on these pages contains forward-looking statements that involve risks and uncertainties. Markets and instruments profiled on this page are for informational purposes only and should not in any way come across as a recommendation to buy or sell in these assets. You should do your own thorough research before making any investment decisions. FXStreet does not in any way guarantee that this information is free from mistakes, errors, or material misstatements. It also does not guarantee that this information is of a timely nature. Investing in Open Markets involves a great deal of risk, including the loss of all or a portion of your investment, as well as emotional distress. All risks, losses and costs associated with investing, including total loss of principal, are your responsibility. The views and opinions expressed in this article are those of the authors and do not necessarily reflect the official policy or position of FXStreet nor its advertisers.
Latest Crypto News & Analysis
Editors’ Picks
BREAKING: Ethereum price hits new all-time high above $2,550
Ethereum price just had a breakout above the previous all-time high at $2,548 and faces no resistance ahead. The digital asset has been outperforming the market for the past two days and it's leading the other coins. The next most significant price target for ETH will be $3,000.
Cardano could slip to a two-month low if key level cracks
Cardano has been trading somewhat sideways for the past two months and established a massive resistance trendline around $1.5. The digital asset could be on the brink of a significant leg down if bulls can’t hold key support level.
Bitcoin hints at following ETH’s explosive rally, XRP indecisive
Bitcoin price seems to be coiling up for an upswing as it trades around a crucial support level. Ethereum, on the other hand, has already seen a massive run-up that might retest its local top. Unlike BTC or ETH, XRP shows signs of a drop from a technical perspective.
Dogecoin loses momentum, but upswing could still evolve
Dogecoin price crashes 35% after the hyped “dogeday420” fails to gather steam. Despite losing its upswing momentum, the meme coin could still surge if it bounces off the immediate demand. On-chain metrics point to a grim outlook for DOGE.
Bitcoin Weekly Forecast: Institutional wave of BTC adoption follows new all-time highs
Bitcoin price hitting a new all-time high and Coinbase’s direct listing are perhaps two of the most important developments surrounding the pioneer cryptocurrency over the past week.