XLM Price Prediction: Stellar on the launchpad ready for liftoff to $0.6
- Stellar is holding above a robust support zone reinforced by the 200 SMA.
- The MACD indicator on the 4-hour chart suggests bears are getting exhausted as bulls fight to take control.
- A break above the confluence resistance formed by 50 and 100 SMAs will trigger massive buy orders.
- The SuperTrend indicator has a bearish impulse, likely to invalidate the bullish outlook.

Stellar has not been able to recover from the rejection at $0.6, the yearly high. Besides, the acute losses across the market this week were a big blow for the bulls. XLM tumbled to $0.3 before making a recovery above $0.4. As technicals start to improve, Stellar is looking forward to an upswing back to $0.6.
Stellar holds above the critical support area
The recovery from $0.3 was more or less reflex. However, Stellar is holding above the descending parallel channel’s middle layer support. In addition to this, the 200 Simple Moving Average (SMA) on the 4-hour chart is in line to offer support.
Similarly, the Moving Average Convergence Divergence on the same 4-hour chart brings to light the growing bullish outlook. For instance, the MACD line (blue) has broken above the MACD line, suggesting that it is time to buy-in. On the other hand, a break above the 50 SMA and the 100 SMA will pave the way for gains toward $0.6.
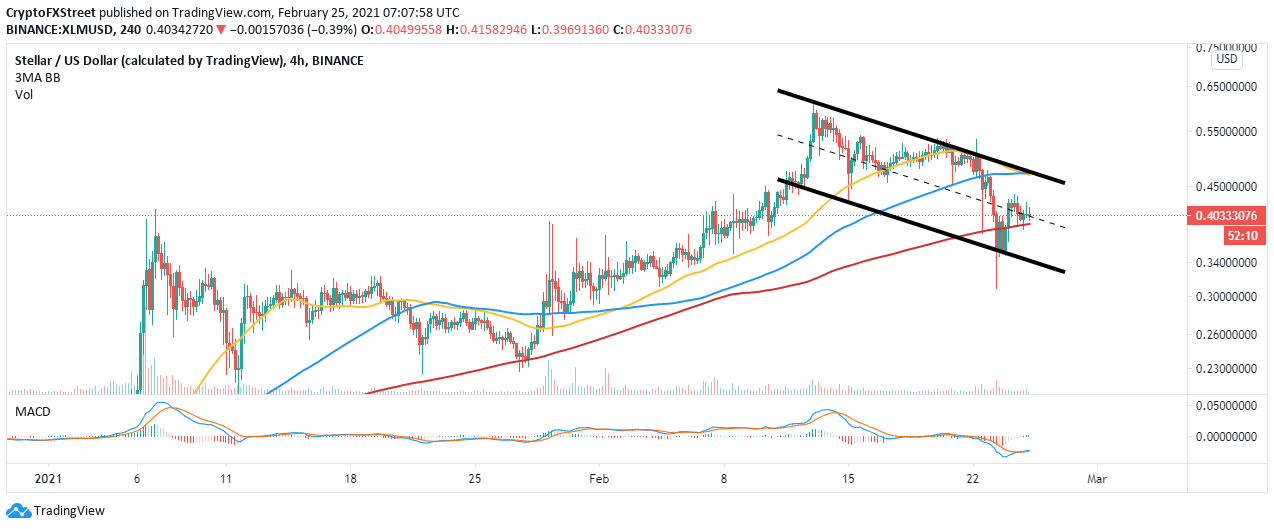
XLM/USD 4-hour chart
The TD Sequential indicator has recently flashed a buy signal on the 12-hour chart. This call to buy was presented in a red-nine candlestick. It implies that the bearish pressure is diminishing as buying pressure begins to surge. If validated, XLM will rally in one to four 12-hour candlesticks, validating the bullish narrative.
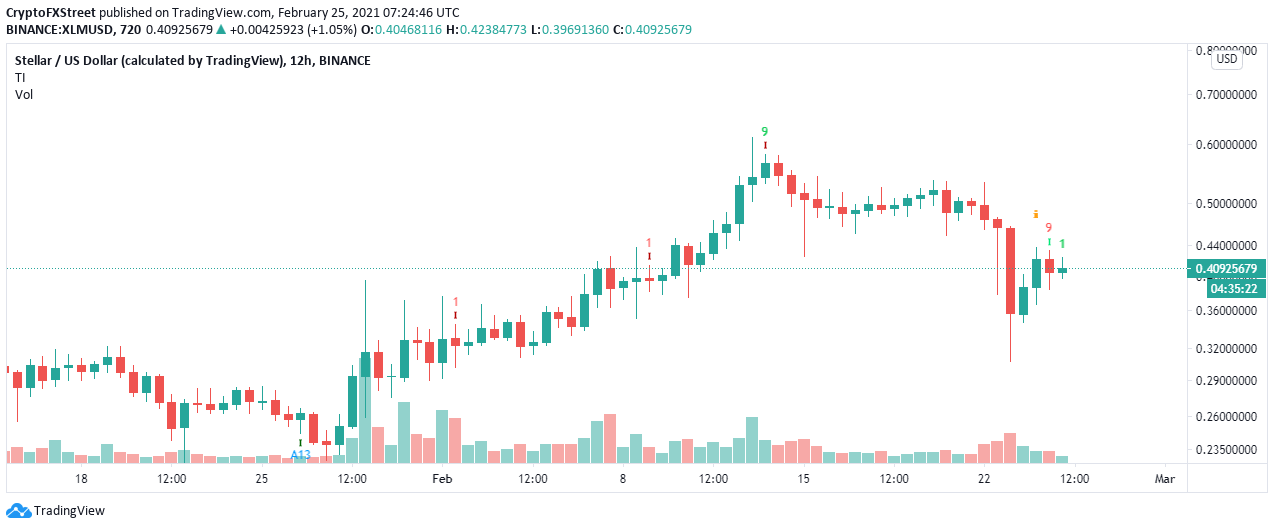
XLM/USD 12-hour chart
Looking at the other side of the picture
The 12-hour chart shows that Stellar is not out of the woods yet based on the SuperTrend indicator. This bearish impulse came into the picture earlier this week, following massive cryptocurrency price declines. XLM recovery will likely lag in the near term until the indicator flips bullish again.
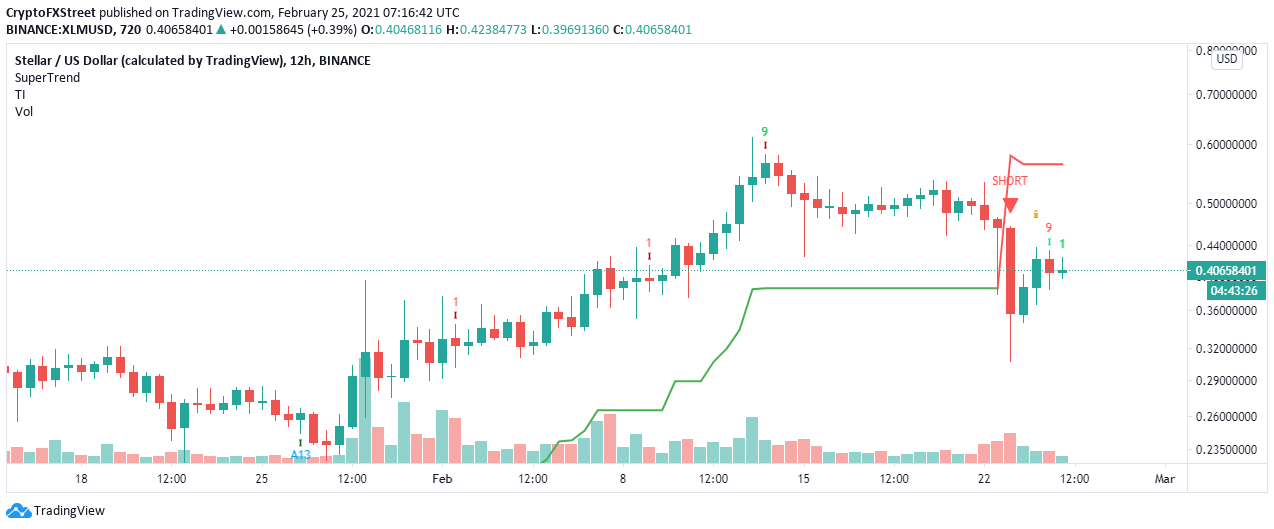
XLM/USD 12-hour chart
Stellar must also hold above the 20 SMA on the 4-hour chart, if not the channel’s middle boundary support, to avoid potential losses. Trading below these critical levels could open the Pandora box, resulting in losses as far as $0.3.
Author

John Isige
FXStreet
John Isige is a seasoned cryptocurrency journalist and markets analyst committed to delivering high-quality, actionable insights tailored to traders, investors, and crypto enthusiasts. He enjoys deep dives into emerging Web3 tren


