XLM Price Prediction: Stellar wriggles at the edge of a cliff amid massive sell signals
- The short-term technical picture is bearish, mainly due to the formation of a rising wedge.
- The MACD on the daily chart adds credibility to the impending breakdown.
- Immediate support by the 50-day SMA could place Stellar on the recovery trajectory toward $0.61.

Stellar is fighting for stability after the freefall from highs of around $0.61. However, short-term analysis hints at the cryptocurrency being massively bearish. The rising wedge pattern could jeopardize immediate support at the 50 Simple Moving Average (SMA) daily chart.
Stellar battles to defend higher support
XLM is trading at $0.41 amid the bulls’ push for gains toward $0.6. On the flip side, the recovery seems to be an uphill battle, especially when printing a rising wedge in the daily timeframe. This pattern occurs amid a generally up-trending market and is formed by two converging trendlines connecting a series of higher highs and consecutive higher lows.
A trend reversal is expected to come into the picture following a breakout below the lower trendline. Note that the breakdown is usually sharp and drastic; therefore, it must accurately be timed to make the most out of it.
Consequently, the Moving Average Convergence Divergence (MACD) hints at the bearish outlook lasting longer. The MACD line (blue) continues to increase the divergence below the signal line. In other words, XLM is still in the sell zone, perhaps until robust support is established.
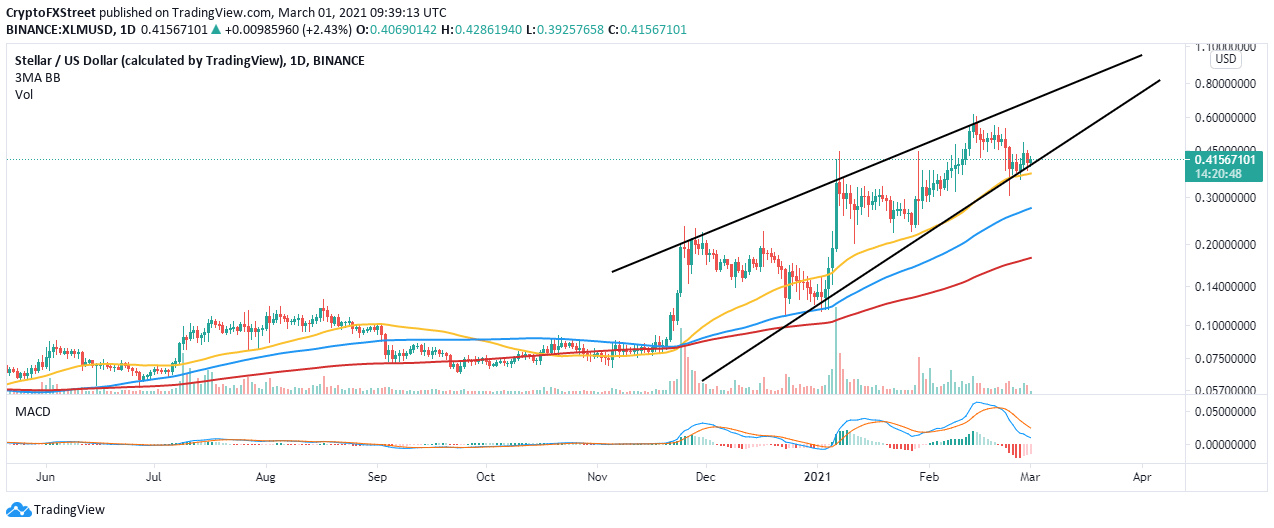
XLM/USD daily chart
The TD Sequential indicator has presented a sell signal on the weekly chart. This call to sell has printed a green nine candlestick. If validated, stellar may fall significantly. It is worth mentioning that after the previous weekly sell signal confirmed, Stellar dropped by nearly 40%.
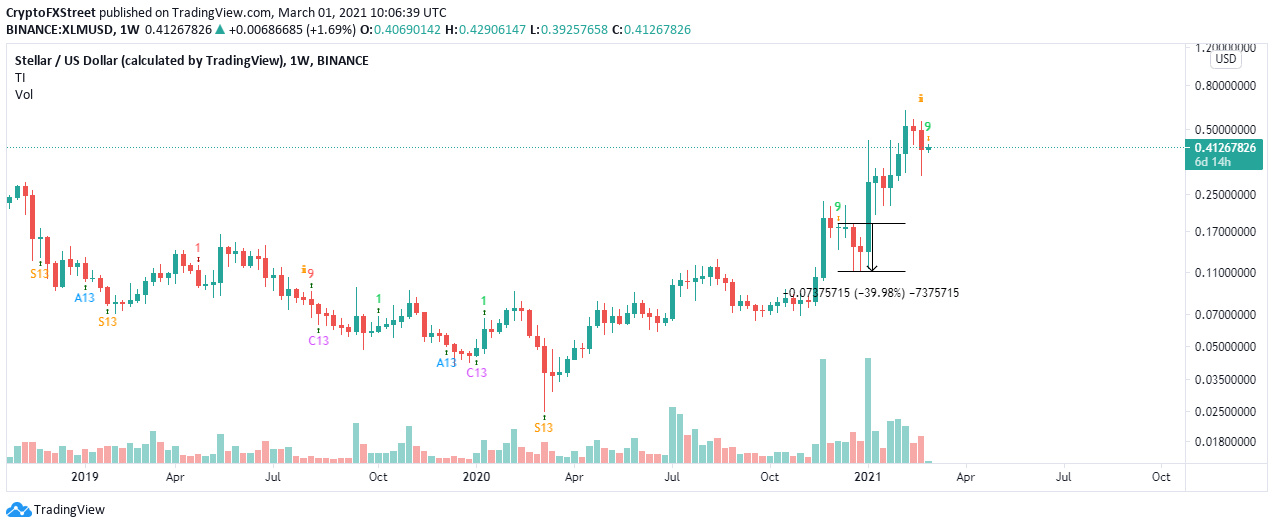
XLM/USD weekly chart
Looking at the other side of the fence
Stellar is also resting marginally above the 50 SMA on the daily chart. Defending this support may renew the bullish outlook and set the pace for recovery to $0.6. If Stellar settles above this level, bulls will start to push for gains eyeing $1.
Author

John Isige
FXStreet
John Isige is a seasoned cryptocurrency journalist and markets analyst committed to delivering high-quality, actionable insights tailored to traders, investors, and crypto enthusiasts. He enjoys deep dives into emerging Web3 tren


