XLM Price Prediction: Stellar buyers are ready for the opportunity to profit
- Stellar is on a downward trending slope.
- A break lower could bring 7% losses.
- Buyers have a good entry point lined up and will keep their powder dry.

Stellar (XLM) is in a classic bearish trend, with the red descending trend line acting as the backbone for the trade short sellers are in. The XLM price descent comes after hitting the high on August 16 at around $0.41. Since then, the highs kept getting lower, and the R1 monthly resistance at $0.32 quickly showed its support, holding price action up.
Let the sellers have their fun, and buyers will have an excellent entry level to take over
Sellers will try to break that R1 monthly resistance level to push buyers out of their longs and make a profit by running their stops. Expect a violent dip if that R1 resistance level gives way at $0.32.
That is where the market is about to stop selling XLM. About 10% further down, a historical level is offering itself at $0.30. That level originates from June 20 and has shown its importance at least five times up to now. Expect that a lot of buyers will have this level as their queue to start buying XLM. That works both ways for sellers as well. They will want to book profit on their shorts when they add a position on the monthly R1 resistance level break, so this level will act as a handover from sellers to buyers.
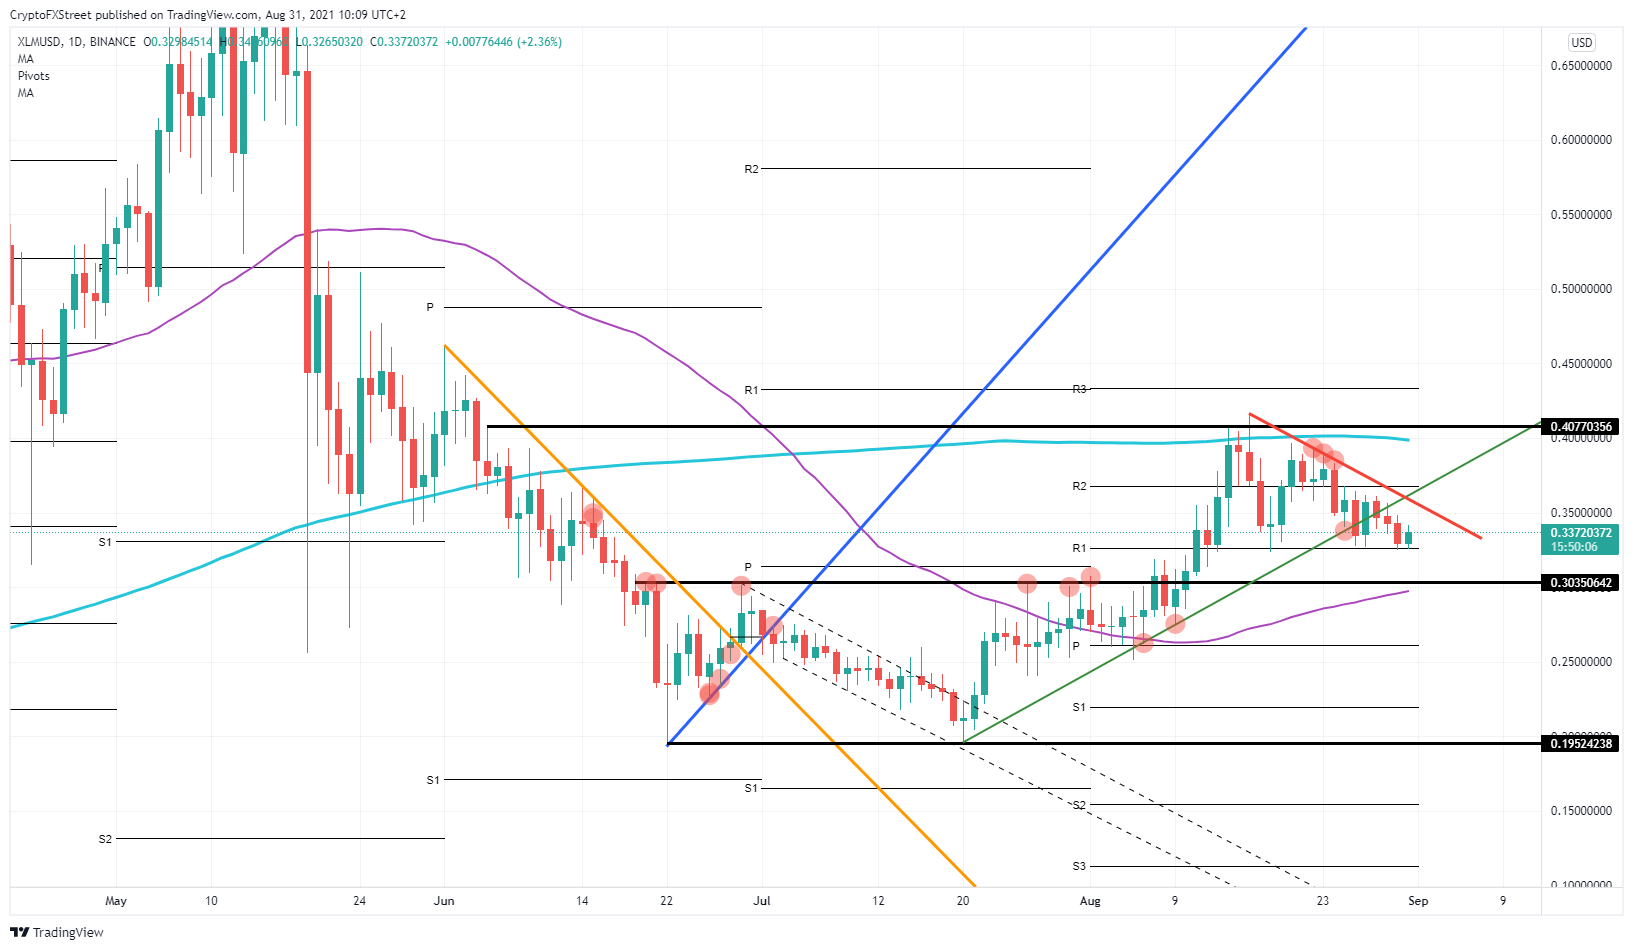
XLM/USD daily chart
Extra motivation for buyers is the 55-day Simple Moving Average (SMA) coming in just below $0.30. Between that 55-day SMA around $0.29 and the historical level at $0.30, it would make it ideal for a tiny fade-in trade for buyers. Buyers will need to watch out for putting their stop below that 55-day SMA.
To the upside, expect a retest of the monthly R1 resistance level at $0.32 before shooting higher toward that red descending trend line again.
For the sellers, a run further down toward the monthly pivot at $0.26 will be tempting but questionable as buyers look for that $0.30 level as their queue.
Author

Filip Lagaart
FXStreet
Filip Lagaart is a former sales/trader with over 15 years of financial markets expertise under its belt.