XLM Price Forecast: Stellar risks spiraling to $0.24 if crucial technical pattern breaks
- Stellar is on the brink of freefall as the symmetrical triangle pattern nears maturity.
- Technical levels continue weakening, as highlighted by the MACD cross.
- A step above the 50 SMA and the 100 SMA confluence could see XLM renew the uptrend toward $0.6.

Stellar is on the verge of another breakdown after failing to break above the barrier at $0.44. Overhead pressure keeps mounting and jeopardizing higher support levels. Meanwhile, XLM is trading at $0.40 amid the fight to maintain stability. However, the current technical picture seems massively bearish.
Stellar moves closer to a 41% downswing
Stellar is dancing within the confines of a symmetrical triangle pattern. Also, bulls face acute resistance at a confluence formed by the 50 Simple Moving Average (SMA) and the 100 SMA.
The symmetrical triangle is created by a couple of trendlines, linking sequential peaks and troughs. Generally, the trendlines are supposed to cross at an approximately equal slope. The pattern illustrates a period of consolidation ahead of either a breakout or a breakdown.
A breakdown occurs from the ascending trendline and identifies the beginning of a downtrend. On the other hand, a breakout happens at the descending trendline and signifies the start of a bullish trend. Symmetrical patterns tend to have precise price targets for the breakout or breakdown, mainly measured from the highest point to the pattern's lowest point.
As for Stellar, a break under the lower trendline would culminate in losses eyeing $0.24. The Bearish outlook is reinforced by the Moving Average Convergence Divergence (MACD). If the indicator remains in a downward trend, Stellar's downward momentum will gain traction.
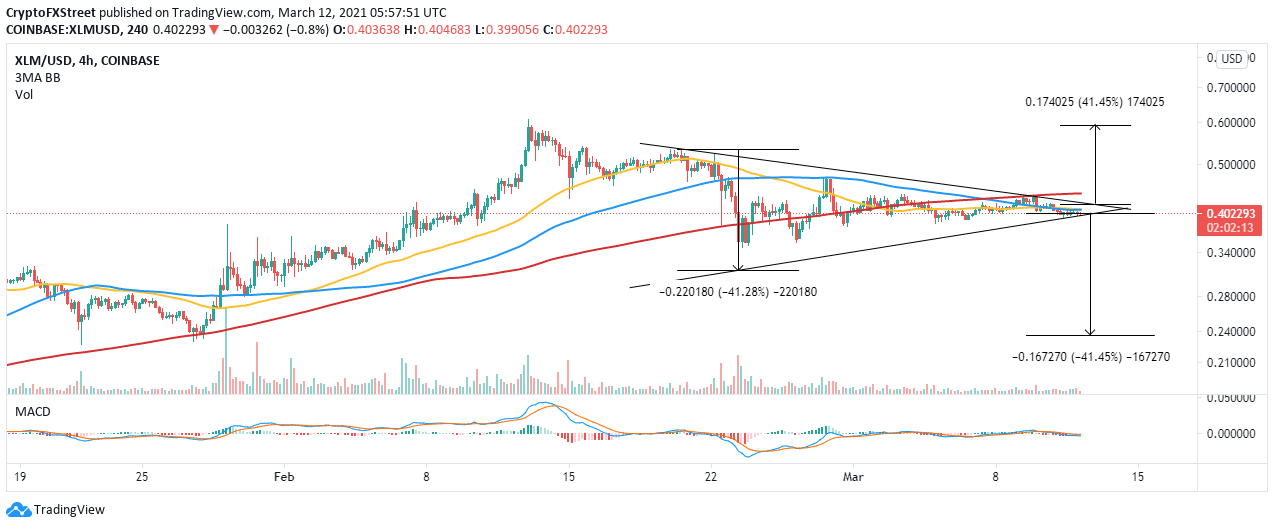
XLM/USD 4-hour chart
The 4-hour parabolic SAR points have recently flipped bearish. When the parabolas (dots) move above the price, it shows that sellers are getting stronger. Therefore, Stellar's impending trendline seems to have been validated.
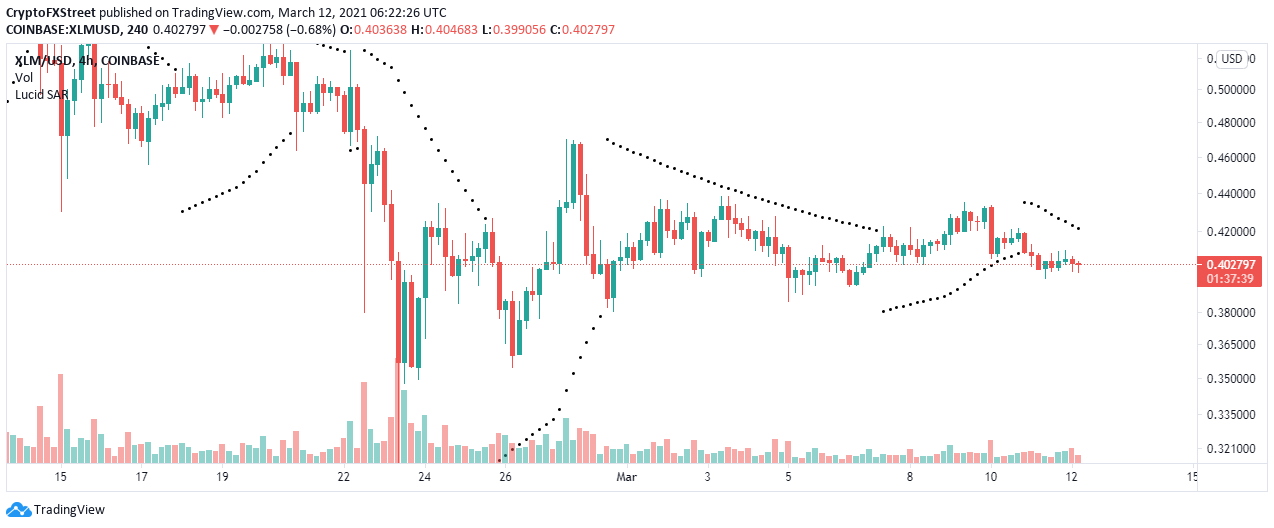
XLM/USD 4-hour chart
Looking at the other side of the picture
Traders should be aware that XLM will throw the bearish narrative out the window if it reclaims the confluence resistance highlighted by the 50 SMA and the 100 SMA on the 4-hour chart. Price action above the upper trendline may also result in a massive 41% upswing to $0.6.
Author

John Isige
FXStreet
John Isige is a seasoned cryptocurrency journalist and markets analyst committed to delivering high-quality, actionable insights tailored to traders, investors, and crypto enthusiasts. He enjoys deep dives into emerging Web3 tren


