Stellar Price Forecast: XLM breaks key support line but bears need validation from 50-day SMA
- XLM/USD stays depressed after reversing from 21-day SMA the previous day.
- Weak RSI, bearish MACD suggest further downside, two-month-old horizontal line adds to the upside barriers.

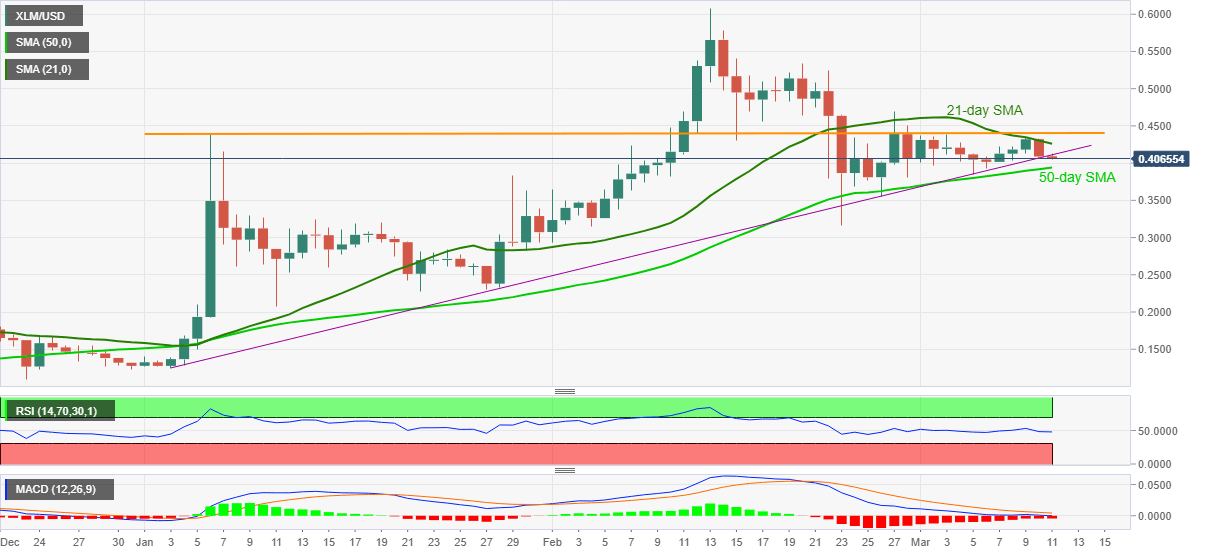
Stellar Lumens (XLM/USD) stays depressed around $0.4070, down 0.50% intraday, during the initial trading on Thursday. In doing so, the cryptocurrency pair extends the previous day’s pullback, also breaking an ascending trend line from early January, amid easing RSI.
Given the bearish MACD also joins the aforementioned catalysts favoring the XLM/USD sellers, the quote is likely to decline further towards a 50-day SMA level of $0.3940.
Should the short-term downward trajectory stretch below the key SMA support, monthly bottom surrounding $0.3850 and the late-February low near $0.3160 will be important to watch.
On the contrary, corrective pullback beyond the support-turned-resistance, at $0.4120 now, will not only have to cross the 21-day SMA level of $0.4261 but also keep XLM/USD strong beyond a horizontal area from January 06 to recall the buyers.
Following that, $0.5100 and the previous month’s peak surrounding 0.6085 should lure the XLM/USD bulls.
XLM/USD daily chart
Trend: Bearish
Author

Anil Panchal
FXStreet
Anil Panchal has nearly 15 years of experience in tracking financial markets. With a keen interest in macroeconomics, Anil aptly tracks global news/updates and stays well-informed about the global financial moves and their implications.


