XLM Price Analysis: Stellar stares into the abyss amid a strengthening bearish front
- Stellar is fighting for stability after suffering rejection from the 200 SMA.
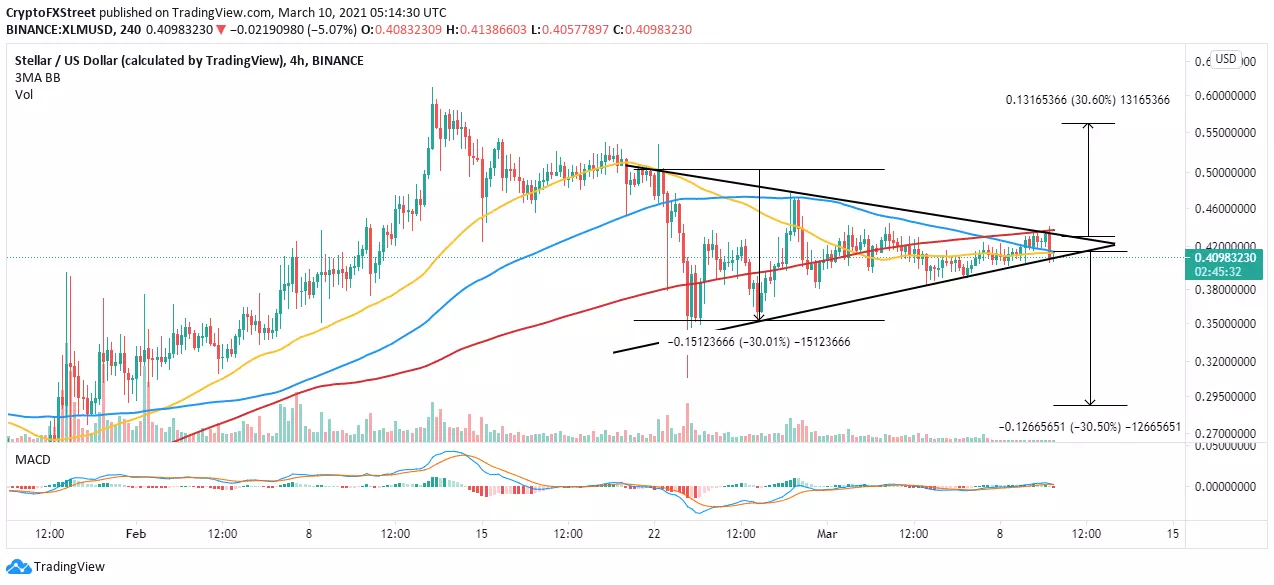
- A potential symmetrical triangle hints at a 30% breakdown to $0.28.
- Closing the day above the 50 SMA and the 100 SMA could see Stellar commence recovery.

Stellar is slightly bearish at the time of writing after correcting from the resistance at the 200 Simple Moving Average (SMA) on the 4-hour chart. Immediate support is accorded to XLM by the symmetrical triangle pattern. However, it is not strong enough to hold for long, and a breakdown could ensue.
Stellar bulls fight to avoid acute losses
XLM is trading at $0.41 while battling resistance at a confluence formed by the 50 Simple Moving Average (SMA) and the 100 SMA. Closing the day under this confluence resistance is likely to pave the way to a bearish impulse.
It is worth mentioning that Stellar is dancing at the apex of a symmetrical triangle pattern, likely to result in a colossal breakdown. Symmetrical triangles identify periods of consolidation before either a breakdown or breakout.
A breakdown occurs once the price slices through the lower trendline. Triangles have precise targets measured from the highest to lowest points. In the case of Stellar, such a bearish move could extend to $0.28.
XLM/USD 4-hour chart
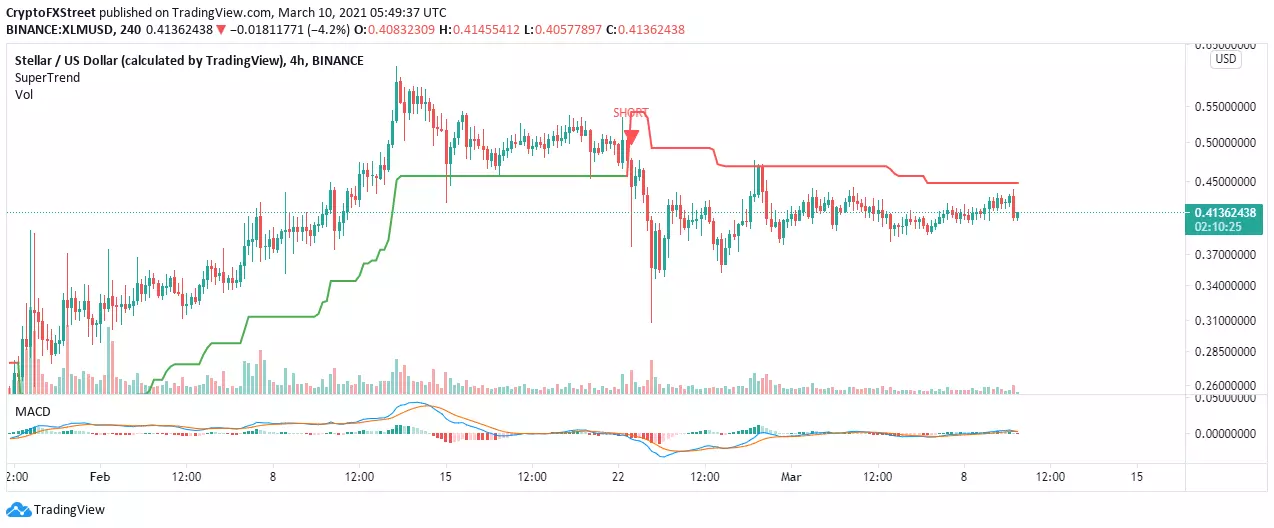
A signal has validated the bearish outlook to short Stellar as presented just before March by the SuperTrend indicator on the 4-hour chart. As long as the bearish impulse is still in place, XLM’s recovery would be hampered.
The Moving Average Convergence Divergence (MACD) on the 4-hour chart suggests that sideways trading will take precedence before the breakdown comes into effect. Note that the MACD line (blue) is not quite under the signal line.
XLM/USD 4-hour chart
Looking at the other side of the fence
Stellar’s recovery will come into the picture if the confluence resistance by the 50 SMA and 100 SMA is pushed into the rearview. Price action above the symmetrical pattern would lead to a 30% breakout to levels above $0.55.
Author

John Isige
FXStreet
John Isige is a seasoned cryptocurrency journalist and markets analyst committed to delivering high-quality, actionable insights tailored to traders, investors, and crypto enthusiasts. He enjoys deep dives into emerging Web3 tren