|

Stellar Price Forecast: XLM will see a 20% correction unless the buyers can prevent it

  • Stellar price had a breakdown from a symmetrical triangle pattern on the 12-hour chart.
  • The digital asset aims to hit $0.32 in the long-term.
  • XLM bulls must push Stellar above a key resistance level to invalidate the bearish outlook.

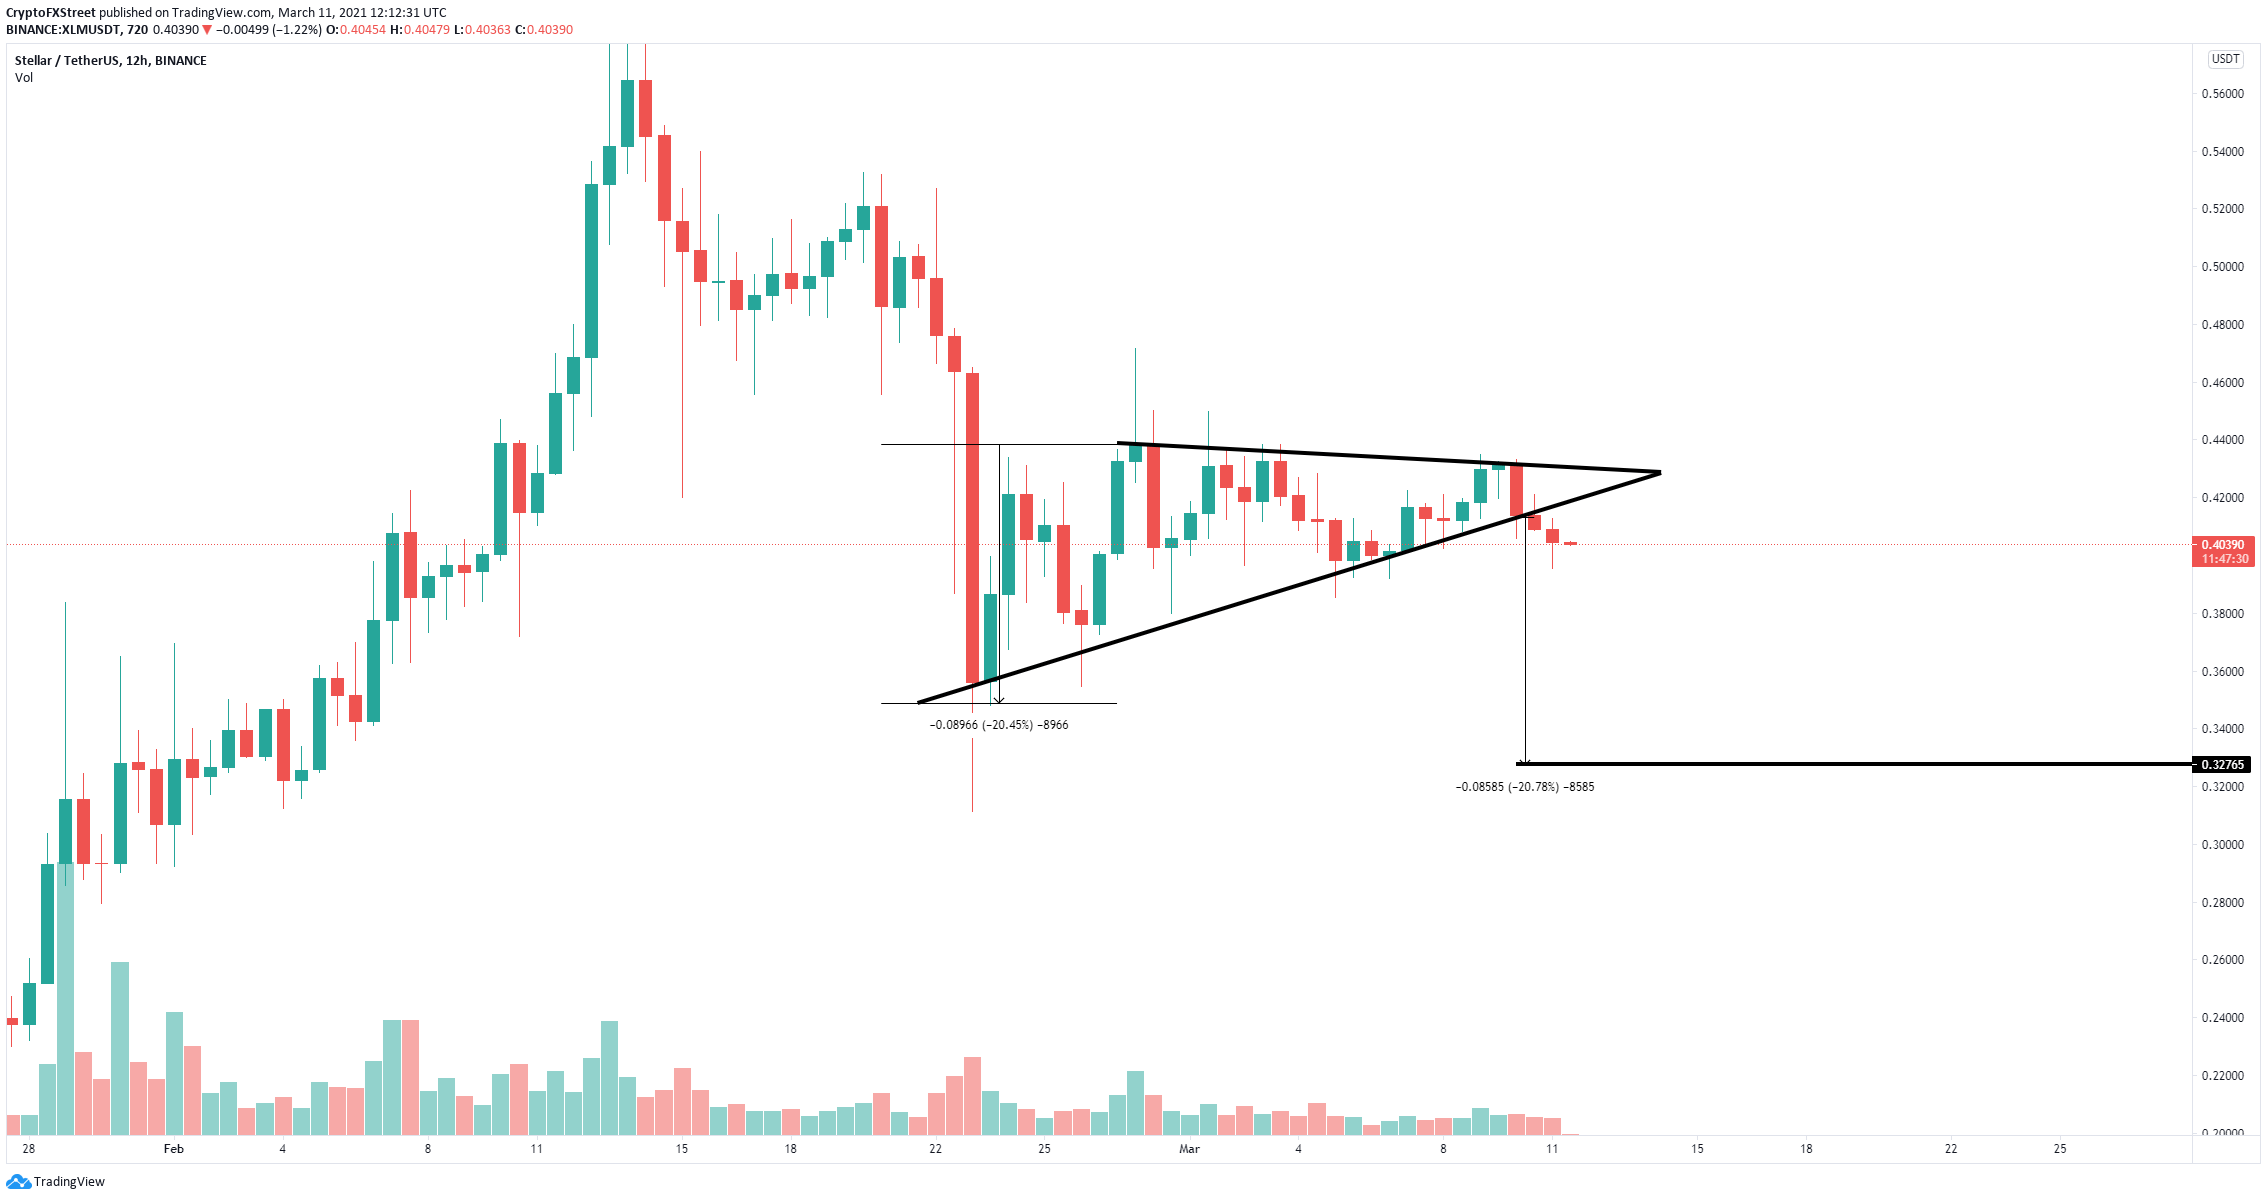
Stellar has been trading below a key resistance level on the 12-hour chart, which has prevented the digital asset from advancing any further. Bears have finally taken the upper hand and aim to drive Stellar price down to $0.32.

Stellar price eying up a 20% correction

The breakdown from the symmetrical triangle pattern on the 12-hour chart has a price target of $0.327, which is a 20% correction calculated using the height of the pattern as a reference. 
xlm price

XLM/USD 12-hour chart

However, bulls still have a chance to prevent this pullback. It is often the case that after a breakdown, the digital asset will try to re-test the previous support, in this case, located at $0.42. 

The ideal scenario for the bears is a re-test of the support into a new leg down towards the price target of $0.327. However, if the bulls can push Stellar price above $0.42 and especially $0.44, they will invalidate the bearish outlook, potentially pushing the digital asset towards $0.52.  

Author

Lorenzo Stroe

Lorenzo Stroe

Independent Analyst

Lorenzo is an experienced Technical Analyst and Content Writer who has been working in the cryptocurrency industry since 2012. He also has a passion for trading.


More from Lorenzo Stroe
Share:

Editor's Picks

CLARITY Act approval odds sink fast ahead of Congressional hearing

The US House Financial Services Committee’s Subcommittee on Digital Assets, Financial Technology, and Artificial Intelligence (AI) is holding a hearing titled “Building the Future of Finance: How the CLARITY Act Unlocks Innovation” on Friday.

Crypto Today: Bitcoin, Ethereum, XRP give back gains as tit-for-tat US-Iran strikes persist

Bitcoin has corrected by more than 1% on the day, trading below $63,000. This is part of a larger retracement from its weekly high of $65,600. Ethereum and Ripple similarly reflect overall pressure, with ETH falling toward the short-term $1,800 support and XRP hovering below the pivotal $1.10 level.

Dogecoin nears yearly low as bearish bias grows

Dogecoin extends its decline on Friday, trading near its yearly low at $0.069 as bearish sentiment continues to weigh on the meme coin. Weakening derivatives metrics and a deteriorating technical outlook suggest a deeper correction if DOGE slips below $0.069.

Pi Network Price Forecast: Mild recovery in PI marks early signs of trend reversal

Pi Network (PI) shows a mild recovery on Friday, following three consecutive days of consolidation, as selling pressure eases after a steep decline earlier this month. Speculative demand for a potential rebound in PI is on the rise as its Open Interest remains elevated.

Bitcoin’s potential recovery in the second half hinges on these 4 catalysts
Bitcoin (BTC) has fallen over 34% in the first half of this year as the King Crypto failed to capitalize on a good semester for risk assets despite the woes from the Iran war.

