Worldcoin price sets for a rally following the breakout of the descending trendline
- Worldcoin price marked a descending trendline breakout, which signals a bullish move.
- On-chain data shows that WLD's daily active addresses are increasing, signaling greater blockchain usage.
- The Exchange Flow balance metric shows WLD tokens are leaving exchanges and Supply on Exchange is decreasing.
- A daily candlestick close below $1.75 would invalidate the bullish thesis.
Worldcoin (WLD) price faces a descending trendline on Thursday; a breakout signals a bullish move. On-chain data shows that WLD's daily active addresses are increasing, signaling greater blockchain usage. The Exchange Flow balance metric reveals that WLD tokens are leaving exchanges, and Supply on Exchange is decreasing, all indicating that WLD could rally in the upcoming days.
Worldcoin price shows potential for a rally
Worldcoin price is currently testing the descending trendline, which has previously acted as resistance. This trendline is drawn by joining multiple swing high levels from early May to mid-July, and a breakout signals a bullish move.
If WLD breaks above the descending trendline and closes above the $3.03 level, it could rally 30% to retest its weekly support at $4.20.
On the daily chart, the Relative Strength Index (RSI) is currently above the neutral level of 50, while the Awesome Oscillator (AO) is on its way to doing the same. If bulls are indeed making a comeback, then both momentum indicators must maintain their positions above their respective mean levels. Such a development would add a tailwind to the recovery rally.
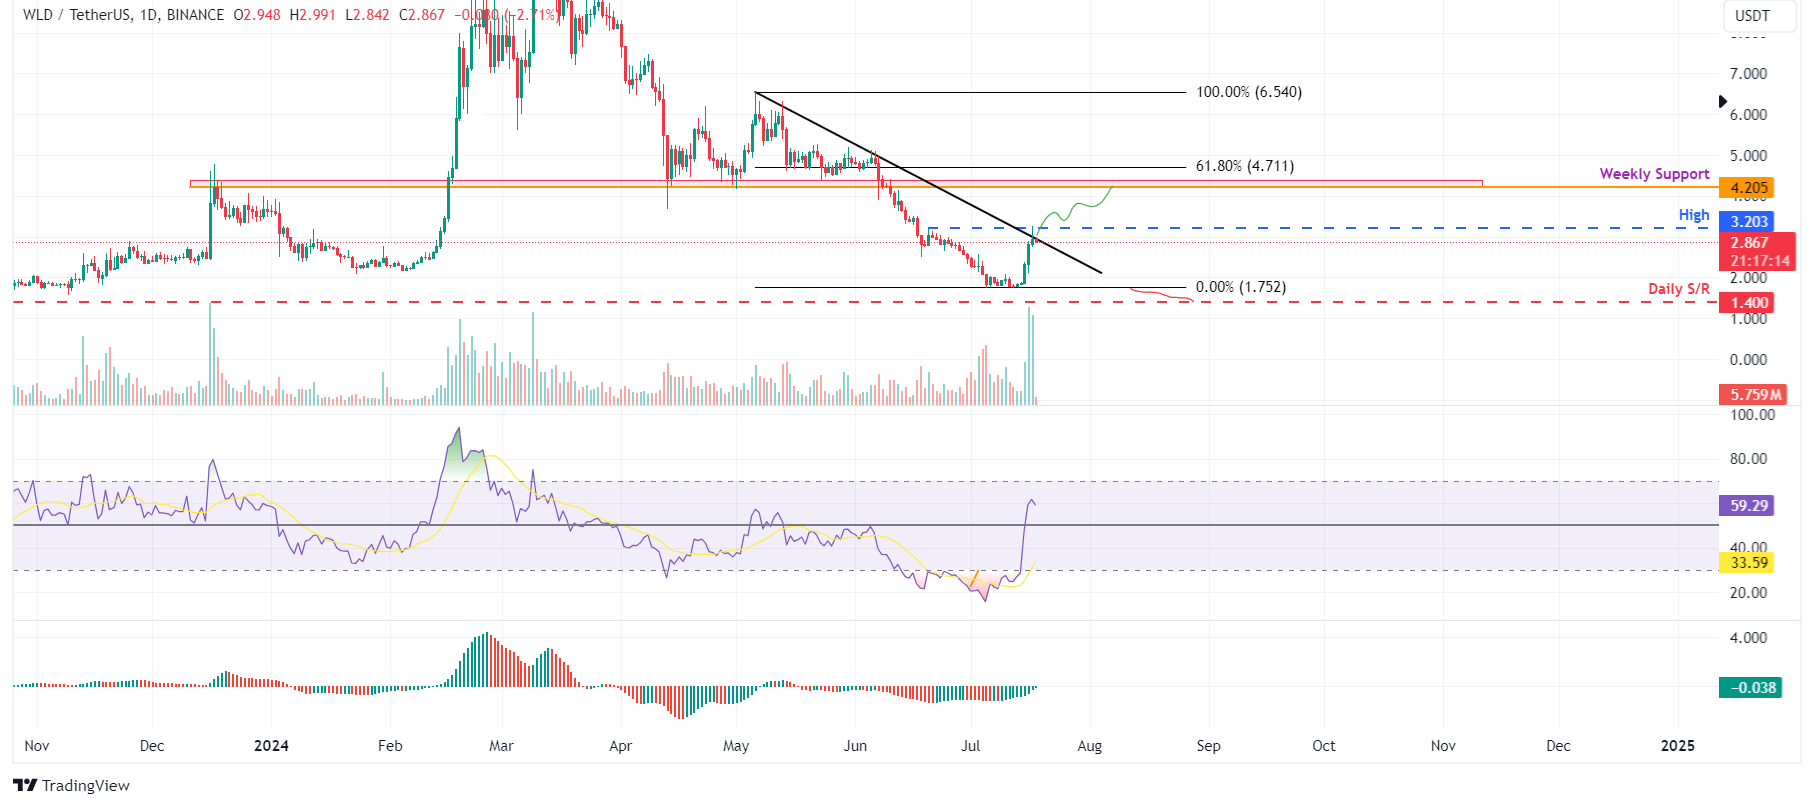
WLD/USDT daily chart
Santiment's Daily Active Addresses index, which helps track network activity over time, aligns with the bullish outlook noted from a technical perspective. A rise in the metric signals greater blockchain usage, while declining addresses point to lower demand for the network.
In WLD's case, Daily Active Addresses have risen by 73% in the last three days. This rise is the highest since mid-March and indicates that demand for WLD's blockchain usage is increasing, which could propel a rally in Worldcoin's price.
%20[08.29.45,%2018%20Jul,%202024]-638568714413677905.png)
WLD Active Addresses chart
Santiment's Exchange Flow balance for Worldcoin shows the net movement of tokens into and out of exchange wallets. A positive value indicates more WLD entered than exited, suggesting selling pressure from investors. Conversely, a negative value indicates more WLD left the exchange than entered, indicating less selling pressure from investors.
In WLD's case, the Exchange Flow balance has slumped from -125,250 on July 13 to -426,720 on July 17, coinciding with a 56% price rise. This negative uptick indicates increased buying activity among investors.
During this event, the WLD Supply on Exchanges declined from 47.74 million to 42.02 million, a 12% decline, which further denotes investor confidence in WLD.
%20[08.39.56,%2018%20Jul,%202024]-638568714837252781.png)
WLD Exchange Flow balance and Supply on Exchanges chart
Even though on-chain metrics and technical analysis point to a bullish outlook, if Worldcoin's price makes a daily candlestick close below $1.75, the bullish thesis would be invalidated by creating a lower low on the daily chart. This development could see WLD's price crash by 20% to retest its next daily support at $1.40.
Author

Manish Chhetri
FXStreet
Manish Chhetri is a crypto specialist with over four years of experience in the cryptocurrency industry.


