Why the recent Cardano price reversal may have been the final turning point
- Cardano price has been rejected from key Fibonacci levels.
- The 8-and 21-day simple moving averages compel post-rejection and can issue a bearish cross in the coming hours.
- Invalidation of the bearish thesis is a breach above $0.52.

Cardano price may have established the final leg of the larger symmetrical triangle. Key levels have been identified.
Cardano price is getting ready
Cardano price could set up one more monsoon-style decline in the coming days. Throughout the summer, the smart contract token has been range bound, consolidating in what appears to be a symmetrical triangle. The Relative Strength Index supports the symmetrical triangle thesis.
There are subtle divergences between each swing, high and low, within the entire formation. Additionally, the most recent swing high took place at the 61.8% retracement level (based on the previous swing high to swing low) and was accompanied by a bearish divergence. Based on these signals, Elliott Wave theory suggests the final E wave of the triangle may be complete.
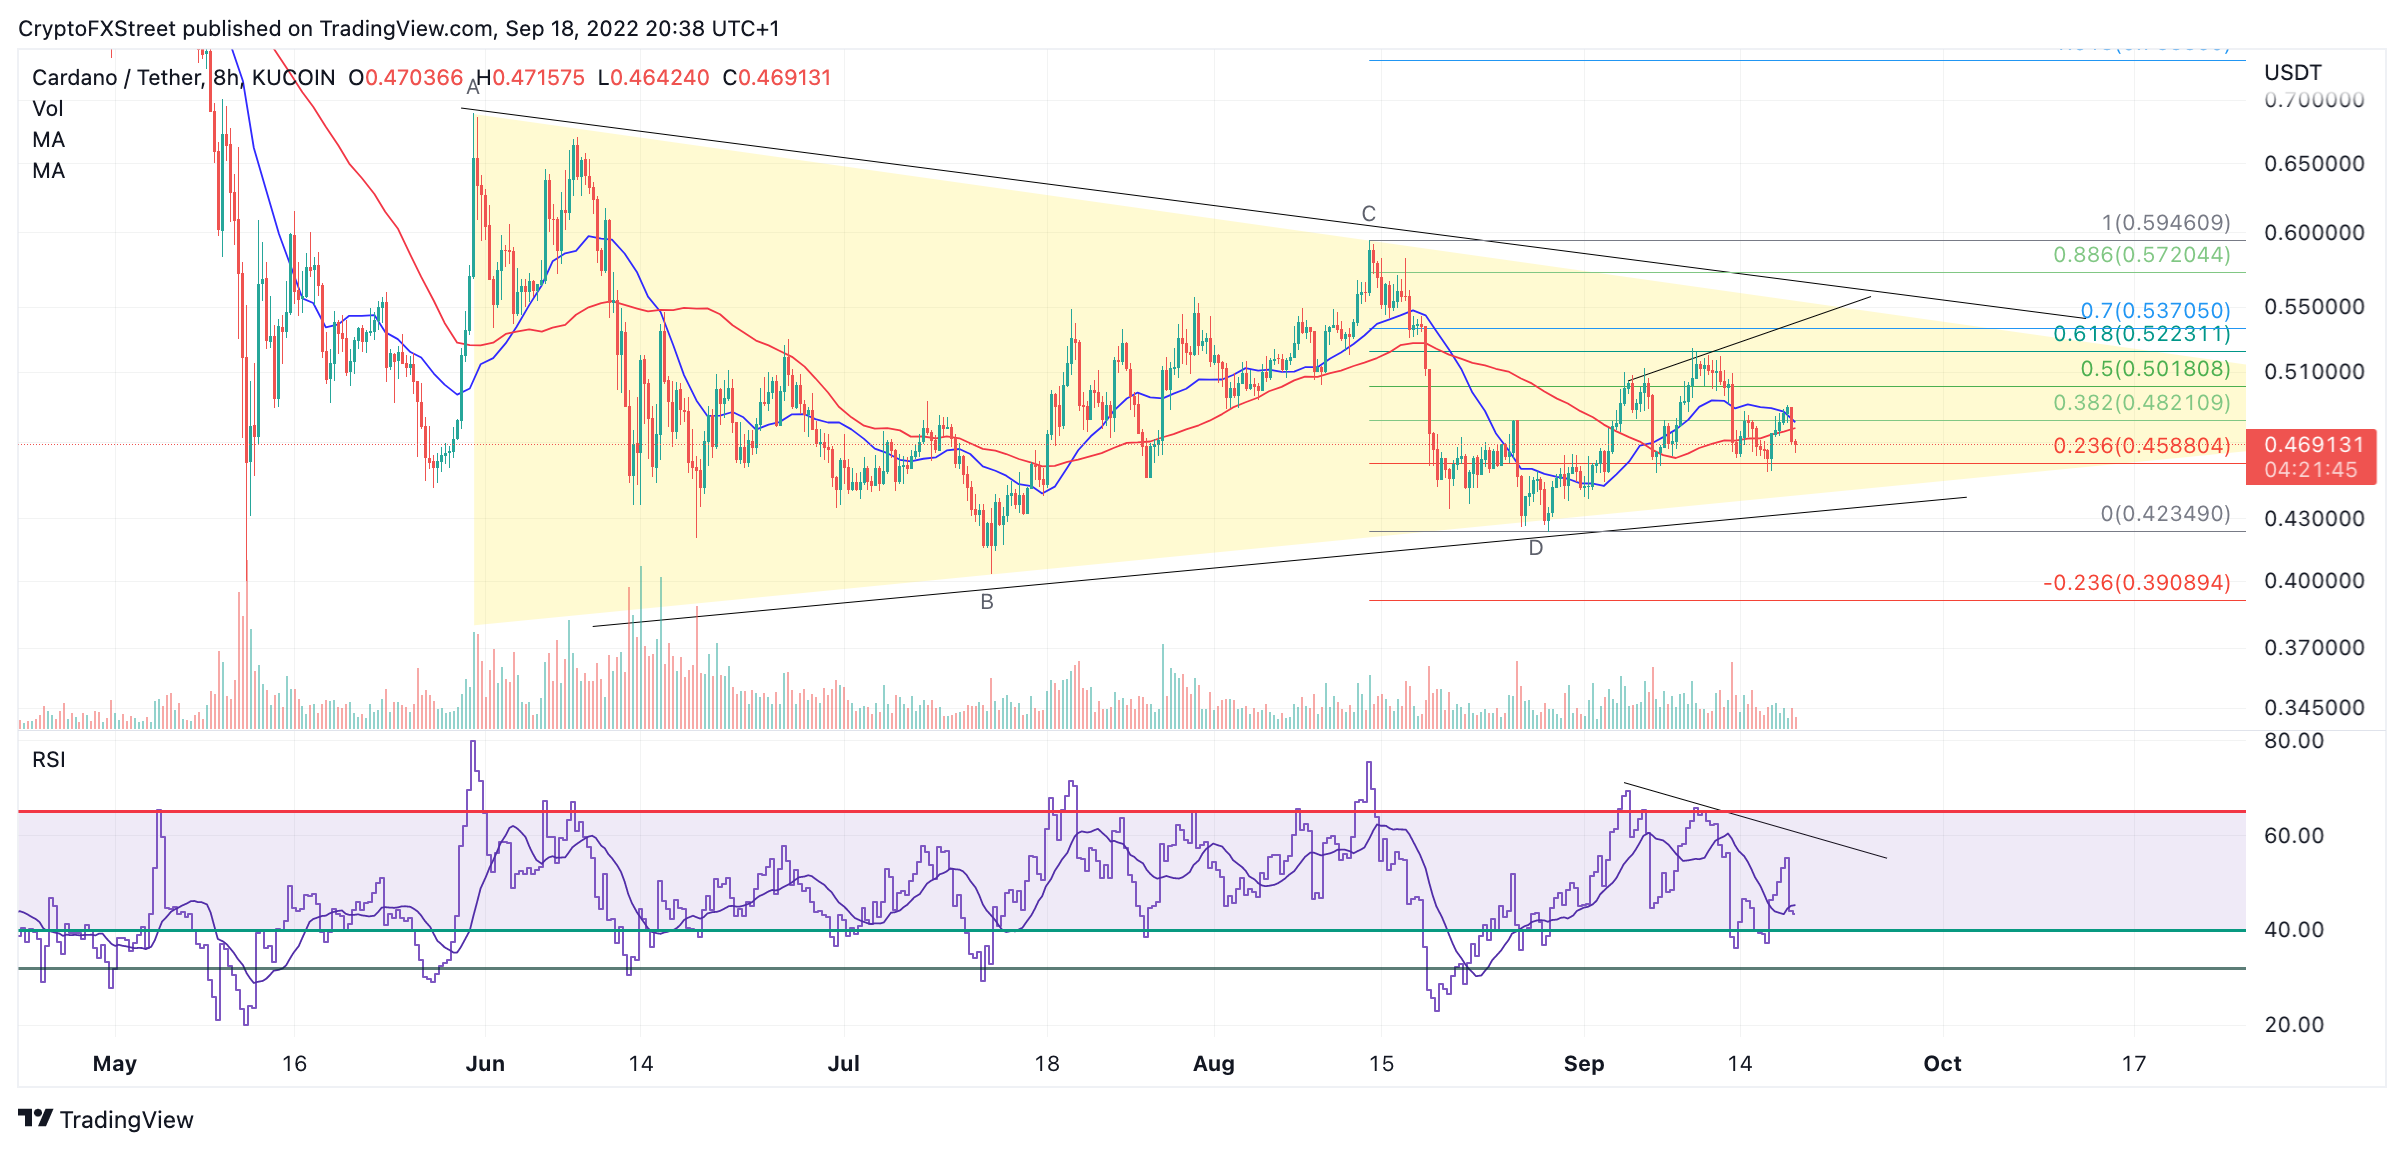
ADA USDT 8-Hour Chart
Cardano price currently auctions at $0.469 as the bears have recently breached both the 8- and 21-day simple moving averages. If the technicals are correct, Cardano's price may already be towards a 40% decline targeting $0.25.
Invalidation of the early entry bearish thesis is a breach above $0.52. If the bulls can hurdle this level, they may be able to rally as high as Fib levels near the $0.64 level. Said price action would result in a 20% increase from the current Cardano price.
In the following video, our analysts deep dive into the price action of Cardano, analyzing key levels of interest in the market. -FXStreet Team
Author

Tony M.
FXStreet Contributor
Tony Montpeirous began investing in cryptocurrencies in 2017. His trading style incorporates Elliot Wave, Auction Market Theory, Fibonacci and price action as the cornerstone of his technical analysis.



![Zcash breaks above 2018 highs, eyes 1600–2500 [Video]](https://editorial.fxsstatic.com/images/i/crypto-coins-1.png)