Why the MATIC price could fall toward $0.60 in October
- MATIC price has rallied 20% since the middle of September.
- Polygon price faces significant resistance near the upper bounds of a descending trend channel.
- Invalidation of the bearish thesis is a breach above $1.05.

MATIC price could witness a sweep-the-lows-liquidation event in the coming weeks. Key levels have been identified.
Matic price shows multiple bearish signals
Matic pride shows a few factors suggesting the uptrend may be waning. Since the middle of September, MATIC has rallied 20%. The Volume Profile Indicator shows a very sparse reading in contrast with the previous MATIC bullrun during the summer. The indicator could suggest that the uptrend is losing strength.
Matic price currently auctions at $0.83. In addition to the low volume, the Relative Strength Index affirms that the uptrend is in jeopardy. Before the current uptrend rally, MATIC bottomed out in the oversold territory. MATIC now faces a key resistance level that forged the last decline at $0.93 into the lows at $0.69. There is also a divergence between the highs.
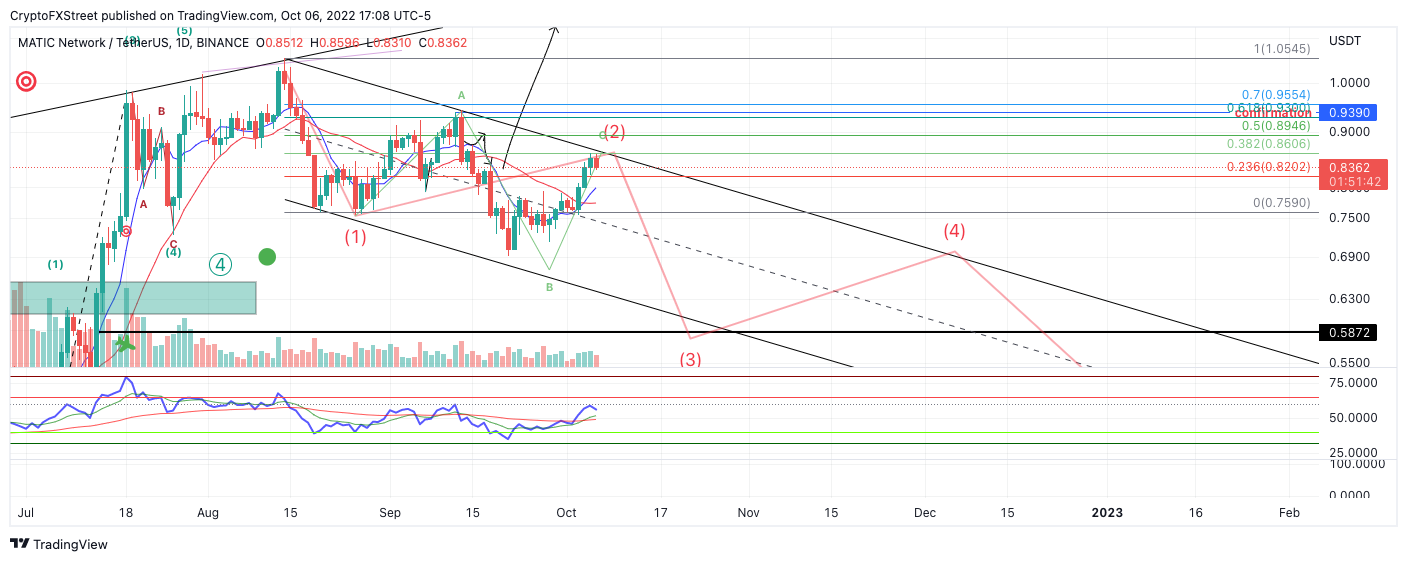
MATIC/USDT 1-Day Chart
Combining these factors, Polygon's MATIC price could set up a sweep-the-lows event targeting the $0.60 congestion zone established in June. Said price action would result in a 25% decline from the current price levels.
Invalidation of the bearish thesis can occur if the bulls hurdle the swing high at $1.05. Traders with a heavier risk tolerance could also use the $0.91 swing high. If the bulls manage to breach the $0.91, a rally toward $1.20 would be on the cards. Such a move would result in a 45% increase from the current MATIC price.
In the following video, FXStreet analysts deep dive into the technicals and fundamentals of MATIC, analyzing key levels in the market
Author

Tony M.
FXStreet Contributor
Tony Montpeirous began investing in cryptocurrencies in 2017. His trading style incorporates Elliot Wave, Auction Market Theory, Fibonacci and price action as the cornerstone of his technical analysis.



