Bulls latch on to Polygon's MATIC price as a 25% rally unfolds
- MATIC price has rallied 10% to start the month of October.
- The Relative Strength Index shows an influx of momentum, supporting an uptrend bias.
- Invalidation of the bullish thesis is a breach at $0.75.

MATIC price sports a strong countertrend rally. Higher targets can certainly be tagged if market conditions persist.
MATIC price rallies higher
Polygon's MATIC price is up 10% on the month as the bulls have stepped into the market with applaudable vigor. Since choppy congestion and suppression of key moving averages near the $0.75 barrier, the Polygon Network token put a decisive end to the madness propelling through multiple barriers. As the price ascends, bulls in the market will be forced to decide if and when an appropriate time will be to book profits.
MATIC price currently auctions at $0.83. During the initial pump, the bulls breached through the 8-day exponential (EMA) and 21-day simple moving averages (SMA). A Fibonacci retracement tool surrounding previous swing-high and swing-low points in the summer shows the bulls are just above the $23.6% retracement level. This is not a strong level for sidelined bears to flex their guns.
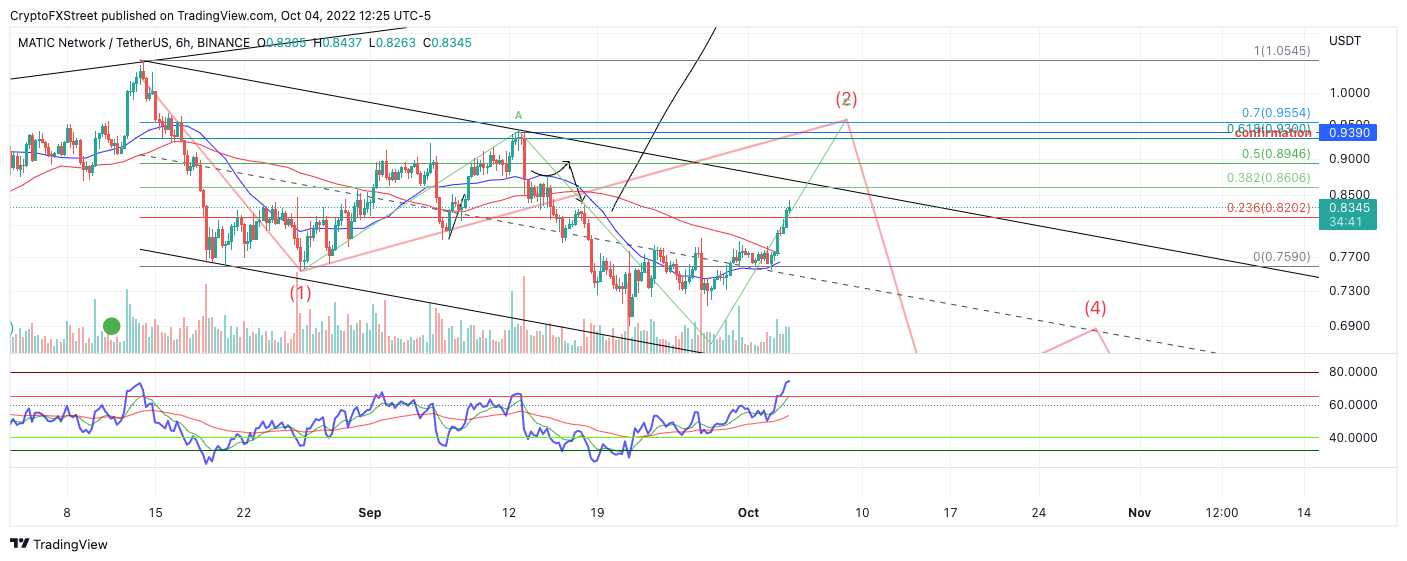
MATIC USDT 6-Hour Chart
Based on the newfound surge, more uptrend should be expected for the self-proclaimed Ethereum Killer token. Traders looking to enter the market should aim for the September high at $0.95. Invalidation of the bullish countertrend play is a breach below the 8-day EMA at $0.75. The uptrend move is likely a suckers' rally if this level is broken. The bears could then flex short, targeting the $0.60 liquidity zone. Such a move would result in a 25% decrease from the current MATIC price.
In the following video, FXStreet analysts deep dive into the technicals and fundamentals of MATIC, analyzing key levels in the market
Author

Tony M.
FXStreet Contributor
Tony Montpeirous began investing in cryptocurrencies in 2017. His trading style incorporates Elliot Wave, Auction Market Theory, Fibonacci and price action as the cornerstone of his technical analysis.


