Why Polygon’s MATIC price could fall hard in Q1 2023
- MATIC price shows a triangular consolidation, indicating the uptrend could be coming to a halt.
- A strong bearish divergence is displayed on larger time frames, prompting concern.
- Multiple strategies can be used to invest/trade the Polygon price.

Polygon’s MATIC price presents confounding bearish evidence that long-term investors should be aware of.
MATIC price coils before the next move
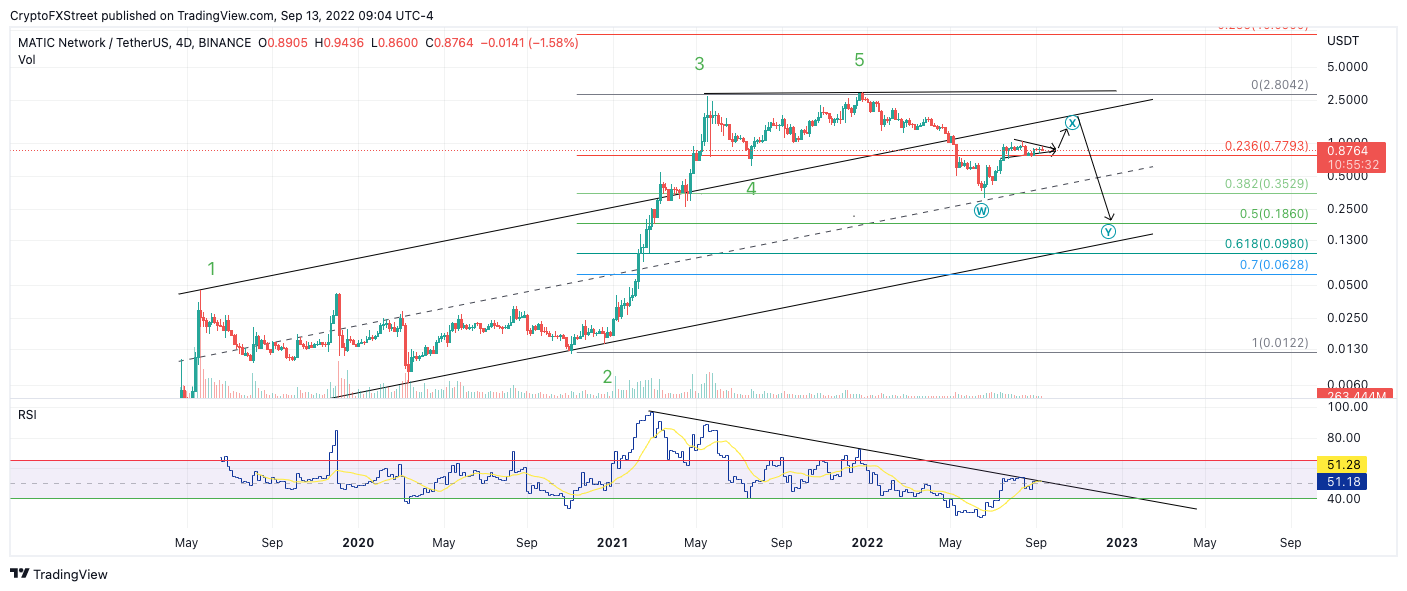
MATIC price currently auctions at $0.86. The smart contract token has been in a sideways congestive zone throughout the summer after rallying 195%. The mundane price action suggests MATIC is forming a triangle. If the triangle thesis is correct, a closing candle above $1.03 could induce a 50% rally, targeting $1.30 before the year ends.
Still, based on Elliott Wave theory, triangles are considered the final pattern before a trend changes direction. Polygon’s MATIC price shows a few reasons to be concerned about the midterm trajectory. The Relative Strength Index shows the significant bearish divergence between each impulsive rally. The Volume Profile Indicator also diverges alongside the RSI.
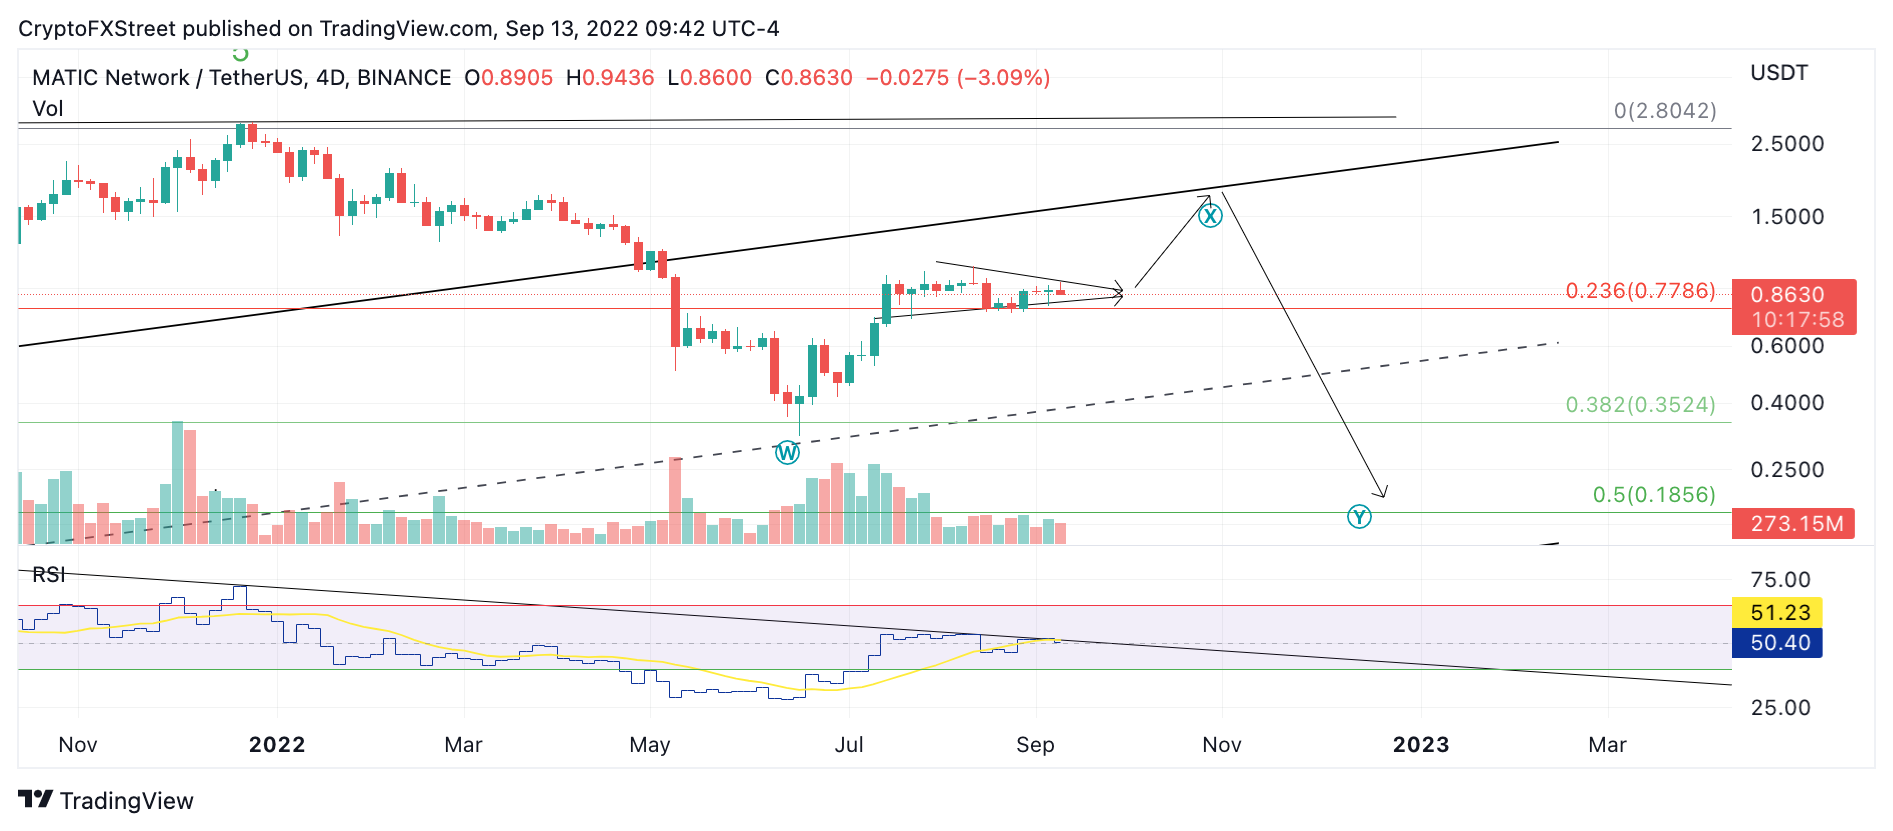
MATIC USDT 4-Day Chart
Macro Concerns
Combining these factors, Polygon’s MATIC price may have finalized its first super cycle impulse wave of a larger degree. If this is true, the next ascension from the triangle consolidation could be the final rise before a much steeper correction occurs.
A Fibonacci Retracement tool surrounding the largest bull run from November 2020 low at $0.01 into the 2021 high at $2.70 has strong Fibonacci levels at the $0.19 and $0.09 price levels. Such a decline would result in an 85% decline from the current market value.
MATIC USDT 4-Day Chart
Unfortunately, Polygon price will have the devastating bearish scenario on the table unless the bulls can reset the RSI and Volume Profile Indicator. New all-time highs for MATIC with a new high on the Relative Strength index would suffice as invalidation for the bearish thesis. Thus, investors should consider a reasonable take-profit approach during Q4 if the market conditions persist.
In the following video, our analysts deep dive into the price action of Bitcoin, analyzing key levels of interest in the market. -FXStreet Team
Author

Tony M.
FXStreet Contributor
Tony Montpeirous began investing in cryptocurrencies in 2017. His trading style incorporates Elliot Wave, Auction Market Theory, Fibonacci and price action as the cornerstone of his technical analysis.


